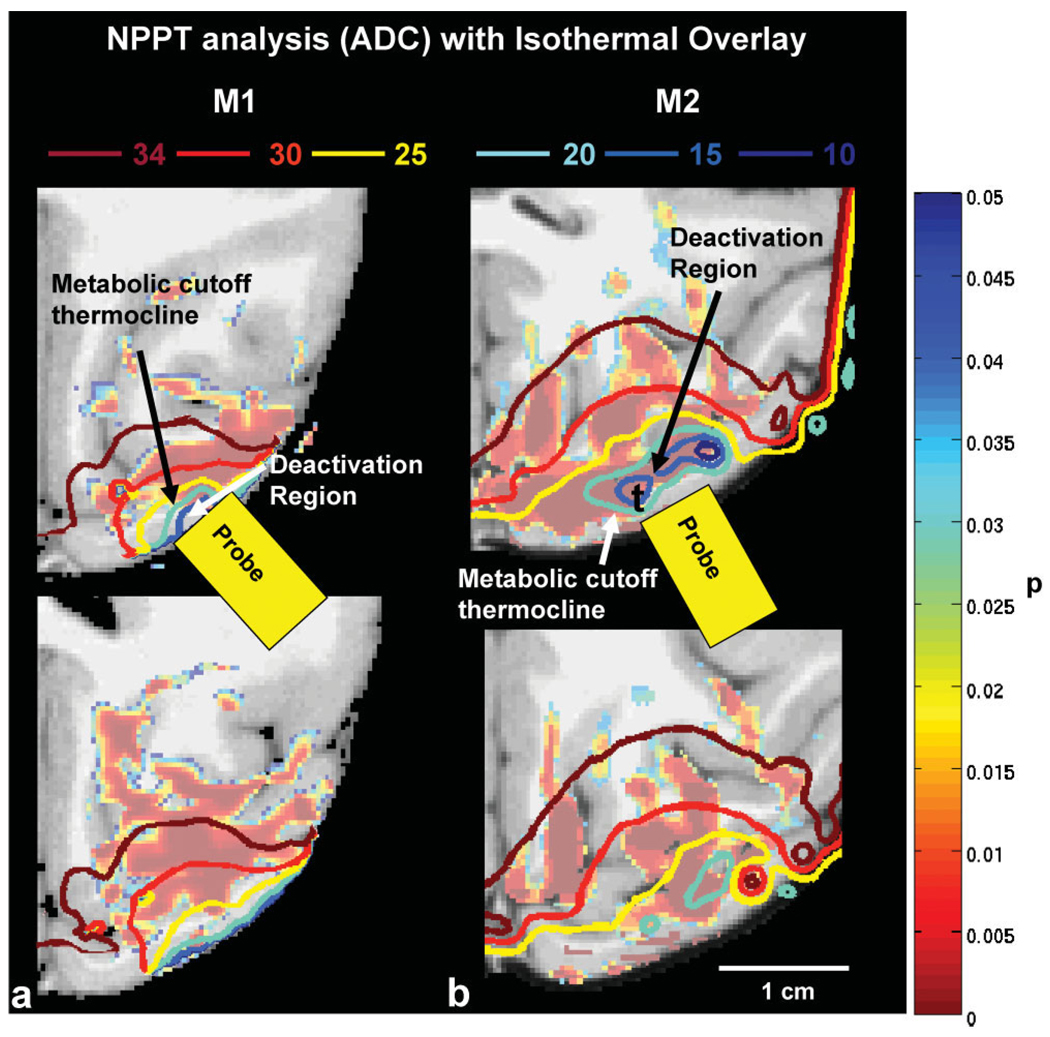
FIG. 4.
a,b: Region where ADC changed significantly (P < 0.05) between the warm and recovery conditions versus the cold condition as calculated by NPPT for (A) M1 and (B) M2. Isothermals at 34, 30, 20, 15, 10°C were overlaid on the images. Note that the statistically significant region extends beyond the cooled region and is present where the temperature has not changed significantly from the body temperature (T > 34°C isothermal).

