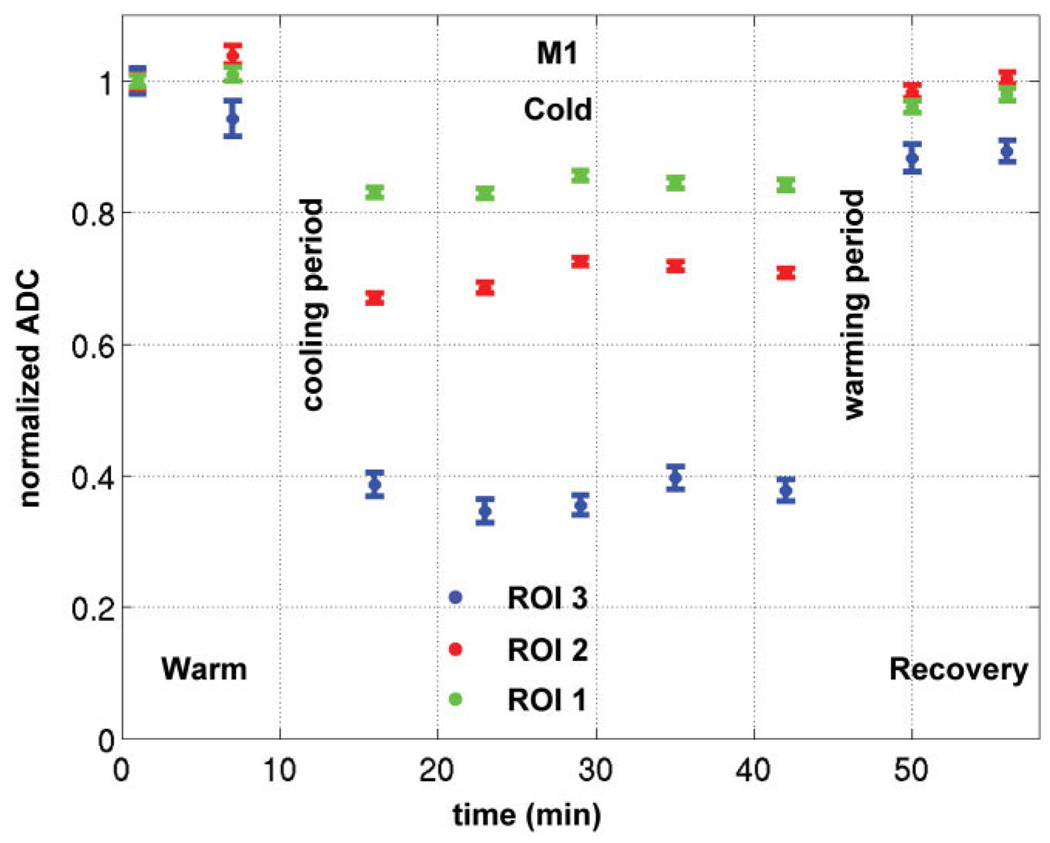
FIG. 6.
Plot of the mean normalized ADC (± SEM) in M1 versus time in three temperature ranges: 8–20°C (ROI 3), 20–34°C (ROI 2), 34–40°C (ROI 1). The ADC was normalized relative to the first warm image for each ROI. The consistent ADC decrease in function of time during the cold condition indicates the brain was already deactivated at the beginning of the cold DTI scans and that the temperature remained constant in each region.

