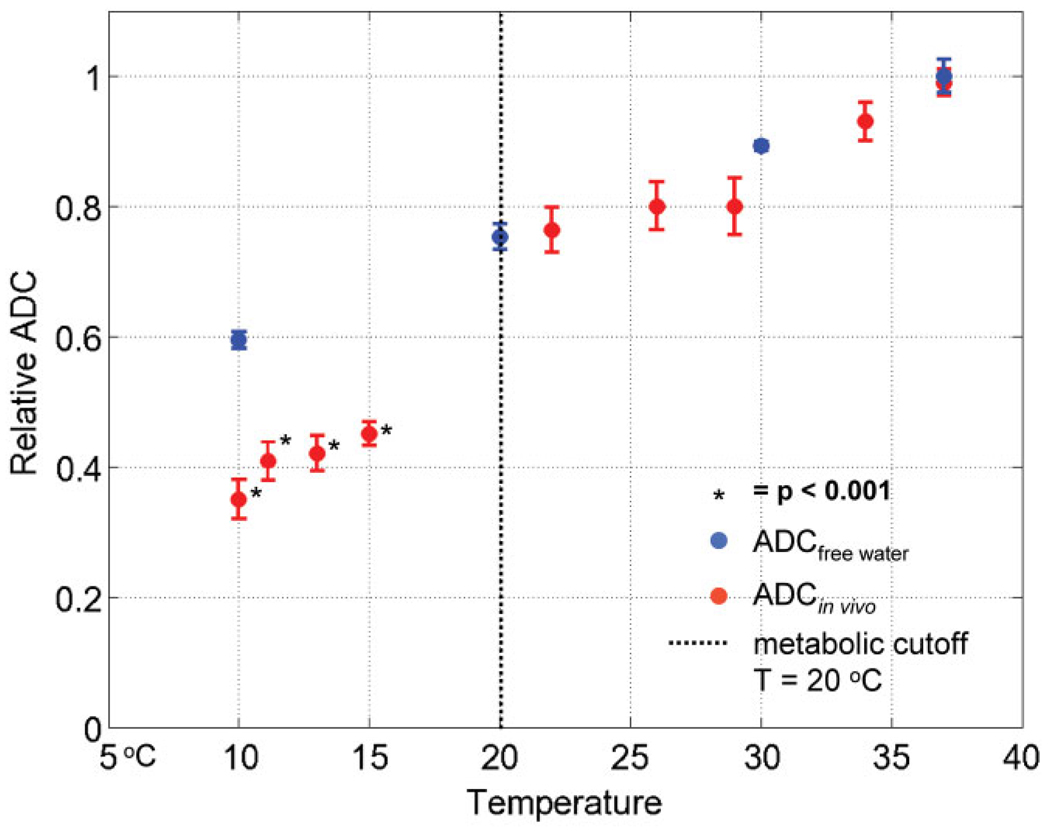
FIG. 7.
The normalized in vivo ADC (ADCin vivo, red) and the normalized ADC of free water (ADCfree water, blue) (32,33) plotted as a function of temperature for the nine reversible deactivation experiments. The deactivated region, T < 20°C (ROI 1), from M1, M2 and M3 was used to compare the ADC between the nine reversible deactivation experiments. Note the ADCin vivo follows the diffusion of free water for T > 20°C, but not below the metabolic cutoff. ADCin vivo values with an asterisk are statistically significant P-values (alpha level = 0.001) from a one sample t-test comparing the difference between the normalized ADCin vivo − ADCfree water (see Table 2).

