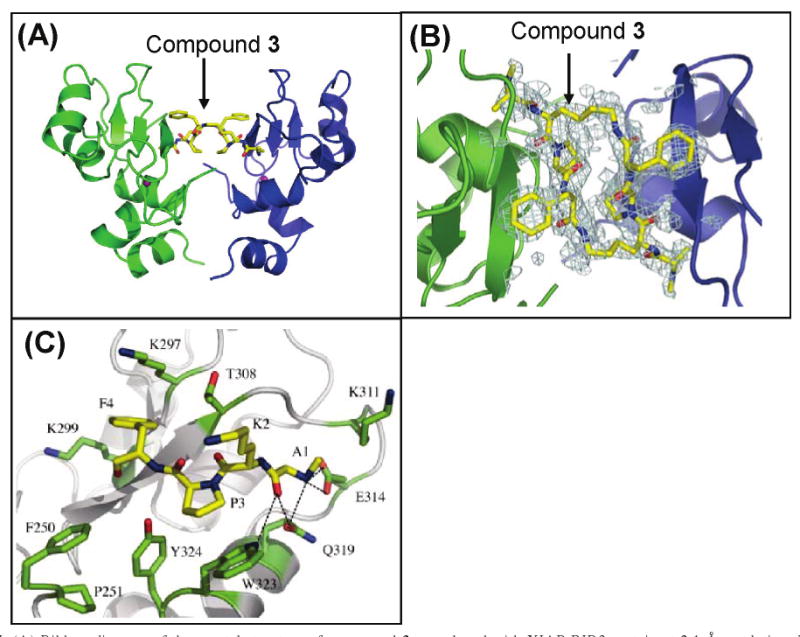
Figure 7.

(A) Ribbon diagram of the crystal structure of compound 3 complexed with XIAP BIR3 protein at 2.1 Å resolution. Zinc ions are colored purple. (B) Initial difference electron density of compound 3 in the XIAP BIR3 binding site. Two XIAP BIR3 molecules are displayed in blue and green, and compound 3 is shown as sticks with carbons colored yellow, oxygens red, and nitrogens blue. (C) Interactions between one BIR3 domain and one binding unit of compound 3. Compound 3 (residues A1, K2, P3, and F4) is shown as sticks with carbons colored yellow, oxygens red, and nitrogens blue; side chains of the BIR3 domain are shown with green carbons.
