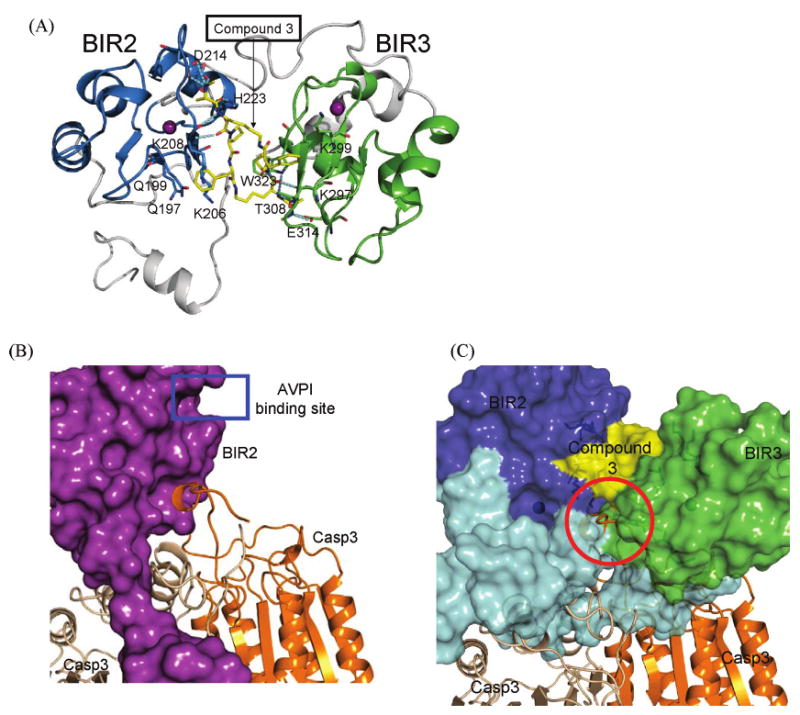
Figure 8.

(A) Proposed model between compound 3 and XIAP L–BIR2–BIR3 protein. Segments colored blue and green are the BIR2 and BIR3 domains, respectively. Segments colored gray include both the linker preceding BIR2 and the loop region between BIR2 and BIR3. Compound 3 is colored yellow. Zinc ions are colored purple. Key residues interacting with compound 3 are displayed, and the hydrogen bonds are depicted as cyan dashed lines. (B) Inhibition of XIAP L–BIR2 (purple) with caspase-3 from the crystal structure (PDB entry 1I3O). (C) Proposed model of inhibition of compound 3 with XIAP L–BIR2–BIR3 against caspase-3. The refined model of XIAP L–BIR2–BIR3 is superimposed with one BIR2 domain in the crystal structure between XIAP BIR2 and caspase-3. Segments colored blue and green are the BIR2 and BIR3 domains, respectively. Segments colored cyan include both the linker preceding BIR2 and the loop region between BIR2 and BIR3. The yellow region is compound 3. Segments colored wheat and orange are the dimeric caspase-3.
