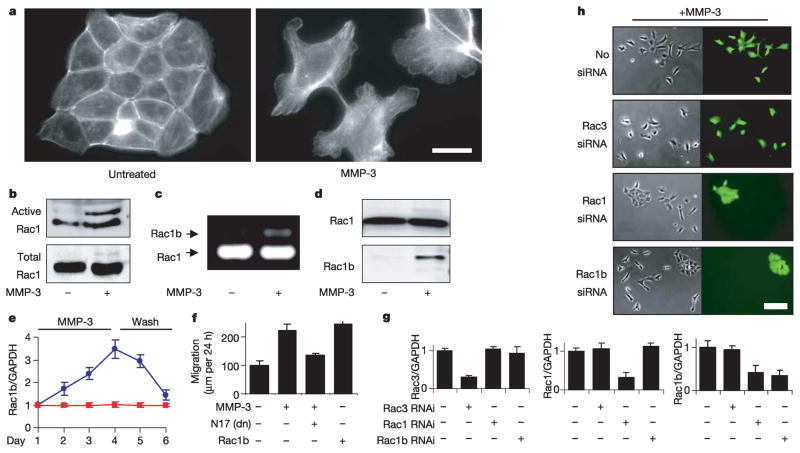
Figure 1. MMP-3 induces EMT through Rac1b.
a, MMP-3-induced alterations in actin cytoskeleton. Scale bar, 25μm. b, Analysis of active and total levels of Rac. c, RT–PCR of Rac1 and Rac1b. d, Rac1b protein expression. e, Rac1b transcript levels in response to MMP-3 treatment (days 1–4) and washout (days 5–6); blue circles, treated; red squares, untreated. f, Cell motility assessed by scratch assay. dn, dominant-negative. g, Quantification of knockdown of endogenous gene expression. h, Selective knockdown of Rac1b inhibits MMP-3-induced cell scattering. Scale bar, 25μm. For all graphs, error bars represent s.e.m.

