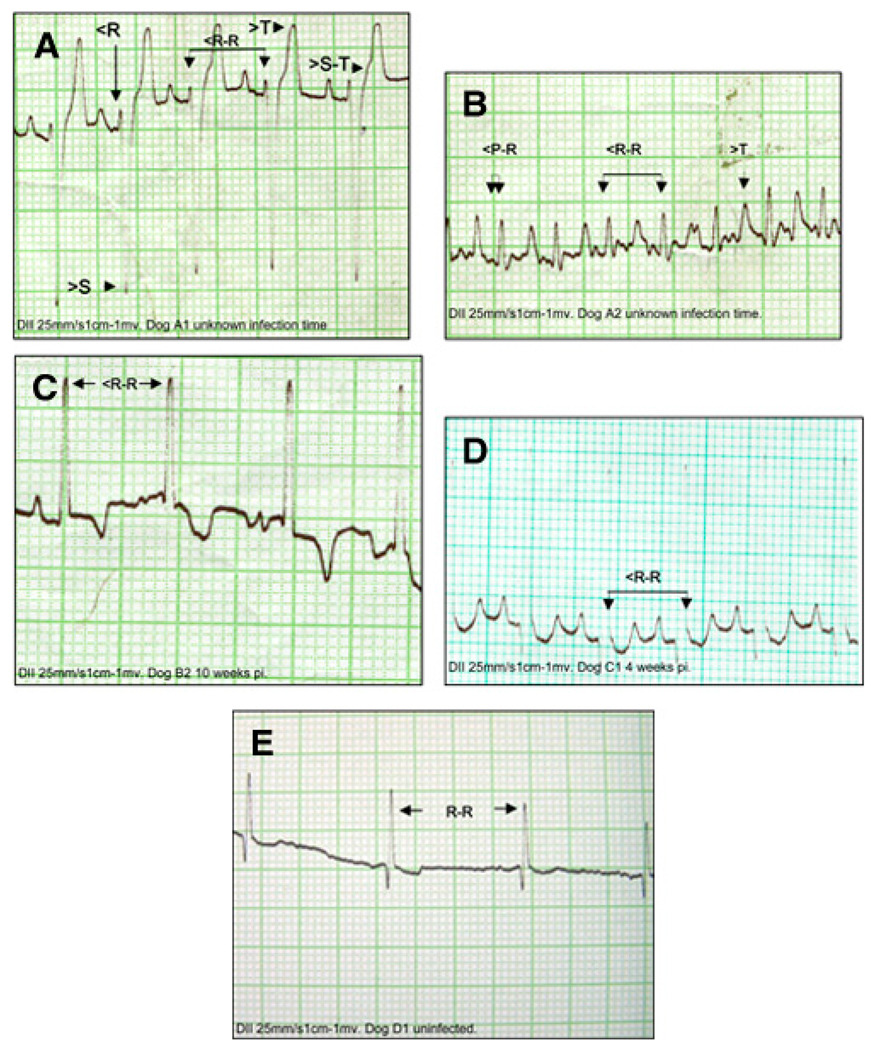
FIGURE 2.
Electrocardiographic recordings taken at 25 mm/s. 1 mm = 0.04 seconds, 1 cm = 1 mV. Shown are lead II recordings from naturally infected dogs (A and B), Zumpahuacan-infected dog at 4 weeks pi (C), Sylvio-X10–infected dog at 4 weeks pi (D), and non-infected dog (E). EKGs show some of the conduction alterations found in infected dogs (interpretation can be seen in Table 2). R-R, normal R-R interval; >S-T, increased S-T segment; >T, increased T wave;<R, decreased R wave; >S, increased deep S wave; <R-R, decreased R-R interval; <P-R, reduced P-R interval. This figure appears in color at www.ajtmh.org.

