
Fig. 3.
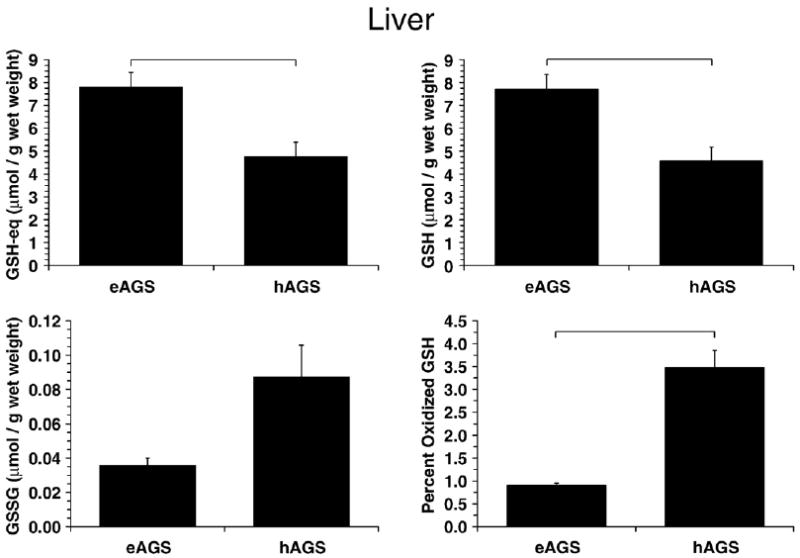
GSH parameters in liver. Percent oxidized GSH was higher in hAGS relative to eAGS (p<0.05, Dunns, n=6) while GSH-eq and GSH was lower in hAGS relative to eAGS (p<0.005, SNK, n=6) as indicated by horizontal bars. For comparison with a familiar species GSH-eq in rat (8.4±0.5 μmol/g wet mass, n=4) was higher than in hAGS (p<0.01, SNK, n=4–6). GSH in rat (8.1±0.5 μmol/g wet mass, n=4) was similar to eAGS but higher than in hAGS (p<0.01, SNK, n=4–6). GSSG was higher in eAGS than in rat (0.13±0.01 μmol/g wet mass, p<0.05, Dunns, n=4–6).