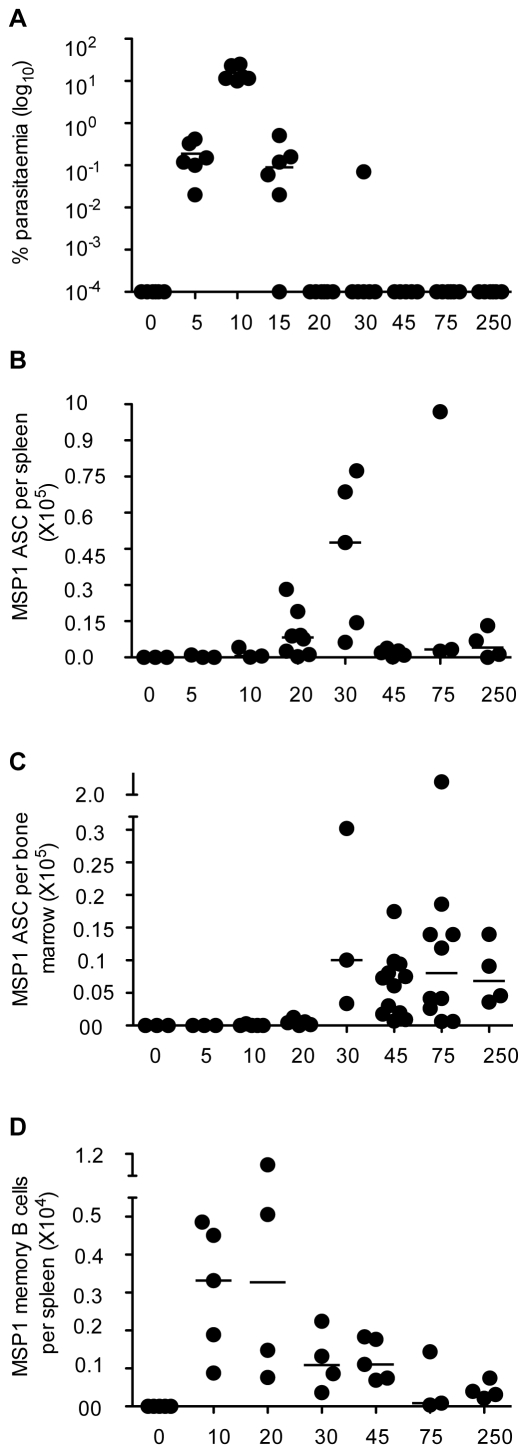
Figure 1. Kinetics of P. chabaudi parasitemia and the contemporaneous B cell responses following a primary infection.
(A) A representative experiment showing the percentage of P. chabaudi iRBC after infection of C57BL/6 mice with 105 P. chabaudi iRBC. Each symbol represents an individual mouse (n = 6) and the horizontal bars show the median values for each time point. (All values of Y = 10−4 or less are overlaid on the X-axis and appear as a single symbol). After day 30 of infection, the percentage parasitaemias were generally either 10−4 (day 45, 5/6 mice) or below detection (day 75). However, presence of parasites can be demonstrated by transferring infected blood into immunocompromised mice for up to 3 months [44]. (B–D) The numbers of MSP-1 specific ASC in spleen and bone marrow, and the number of memory B cells (MBC) were determined at different time points of the P. chabaudi infection by ex vivo (ASC) and in vitro cultured (MBC) ELISpot assays as described in the experimental procedures. (B) Total number of MSP119-specific IgG Ab secreting cells (ASC) in the spleens at different times after infection. (C) Total number of MSP119-specific IgG ASC in bone marrow at different times of a P. chabaudi infection, calculated as described in the experimental procedures. (D) Total numbers of MSP119-specific IgG MBC in spleens of infected and control spleens after polyclonal stimulation and differentiation into Ab secreting cells in in vitro limiting dilution cultures. For (B, C and D) each symbol represents the number of ELISpots in the organs of an individual mouse after subtraction of the mean background value of 3 naïve control mice. Each time point shows ELISpot values from 3 to 8 mice, and the horizontal bars represent the median values. All values of Y = 0 or less are overlaid on the X-axis and appear as single symbols). Changes in numbers of ASC/MBC from one time point to the next were determined using a Mann Whitney test; where significant p values are shown in the text.

