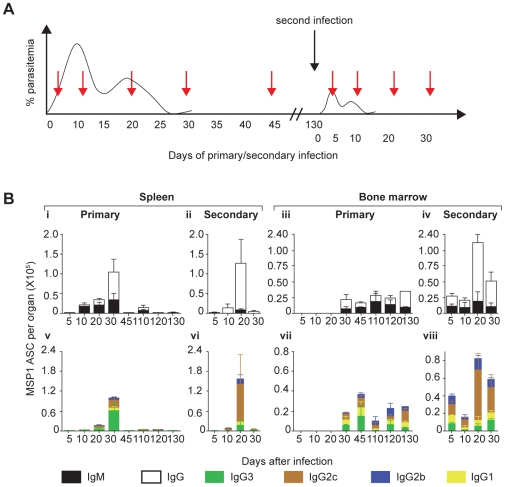
Figure 6. Evidence for generation and maintenance of functional memory B cell in a primary infection.
(A) Cartoon showing the course of the experiment. To compare the kinetics and distribution of ASC secreting different isotypes of anti-MSP119 Ab between primary and secondary infections, C57Bl/6 mice were infected with 105 P. chabaudi iRBC and then rested for 130 days. They were then re-infected with the same dose of iRBC (black arrow), together with previously naïve age-matched controls (primary infection). Mice from both groups (primary and secondary infections) were then sacrificed at the different time points (red arrows) and numbers of MSP119-specific ASCs of different isotypes present in spleens and bone marrow determined in ex vivo ELISpot assays. (B) (i, ii) Relative numbers of MSP119-specific IgG (open bars) and IgM (filled bars) specific ASC in spleens of infected mice following primary and secondary infections at different time points following infection. (iii, iv) Relative numbers of MSP119-specific IgG (open bars) and IgM (filled bars) specific ASC in bone marrow of infected mice following primary and secondary infections at different time points following infection. (v, vi) Relative numbers of MSP119-specific IgG subclass ASC (IgG1 [yellow bars], IgG2c [brown bars], IgG2b [blue bars] and IgG3 [green bars]) specific ASC in spleens of infected mice following primary and secondary infections at different time points following infection. (vii, viii) Relative numbers of MSP119-specific IgG subclass ASC (IgG1 [yellow bars], IgG2c [brown bars], IgG2b [blue bars] and IgG3 [green bars]) specific PC in bone marrow of infected mice following primary and secondary infections at different time points following infection. In each case, the means and standard errors of the mean for 3 to 5 mice at each time point are shown.

