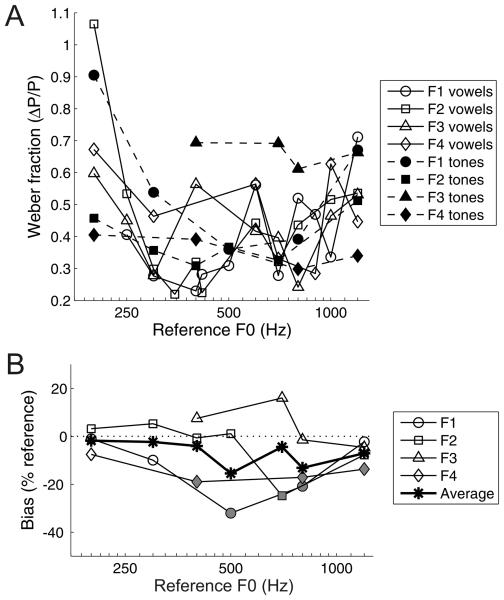
FIG. 10.
Performance of four ferrets on a tone discrimination task. (A) Weber fractions of four ferrets across a range of reference F0s, measured with either the artificial vowel (open symbols, solid lines) or with pure tones (filled symbols, dashed lines). Data for each ferret are displayed with a unique symbol, as shown in the legend. (B) Bias of four ferrets on the tone discrimination task. Biases were calculated and are presented as described for Fig. 7.

