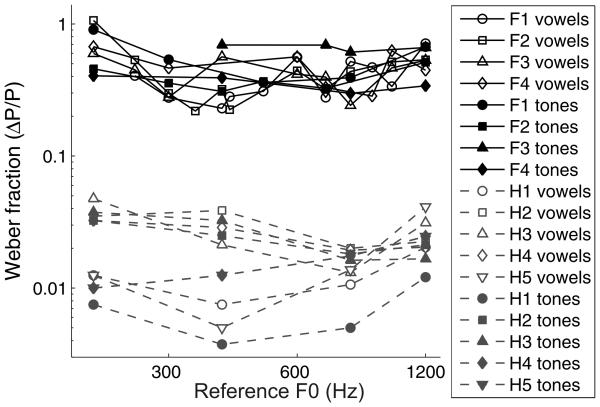
FIG. 11.
Weber fractions of four ferrets and five human listeners on the pitch discrimination tasks. Data for each ferret are displayed with black symbols connected by black lines, and human data are displayed with gray symbols connected by gray lines. Weber fractions for each subject were measured using artificial vowels (open symbols) and tones (filled symbols).

