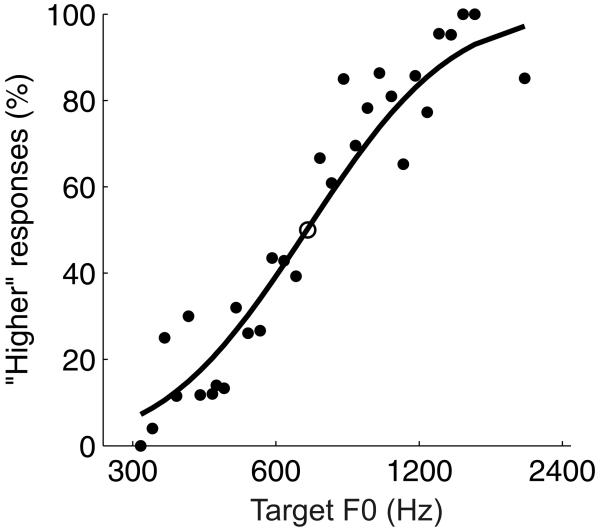
FIG. 4.
Performance of one ferret (subject F1) on the discrimination task when the reference vowel had a fundamental frequency of 700 Hz. The percentage of right spout choices is plotted as a function of the fundamental frequency of the target sound (black dots), and the reference F0 is indicated by an open circle plotted at 50% choice probability. The psychometric curve, a fitted cumulative Gaussian distribution function, is also shown (black line).

