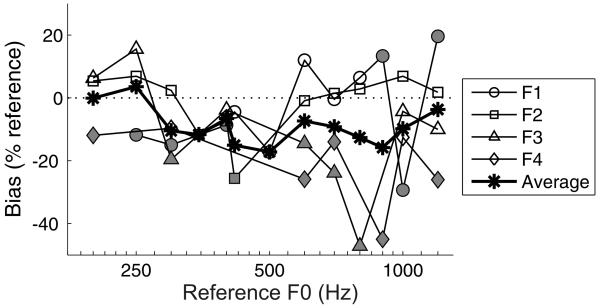
FIG. 7.
Bias of four ferrets on the pitch discrimination task. Biases were calculated as the distances, in Hertz, between the 50% right choice probability obtained from the fitted psychometric function and the corresponding reference F0, so that positive values indicate a bias towards the left (“lower”) spout and negative values indicate a bias towards the right (“higher”) spout. These biases are normalized by the reference F0. Data for different animals are plotted with different symbols, and bias values that are significantly different from zero (99.87% confidence intervals; 0.05 alpha with Bonferroni correction) are shown in gray, with non-significant values in white. The average percentage of bias across all four animals is plotted with asterisks. A dotted line is shown at a bias of zero, for reference.

