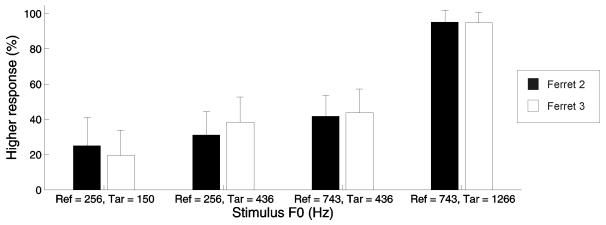
FIG. 8.
Performance of two ferrets when the reference roved between two F0 values across trials. Right spout choice probabilities (mean + standard deviation, across 8 consecutive testing sessions) are plotted across the four reference and target combinations presented in the “variable reference” testing sessions. This type of testing was carried out with Ferret 2 (black bars) and Ferret 3 (white bars).

