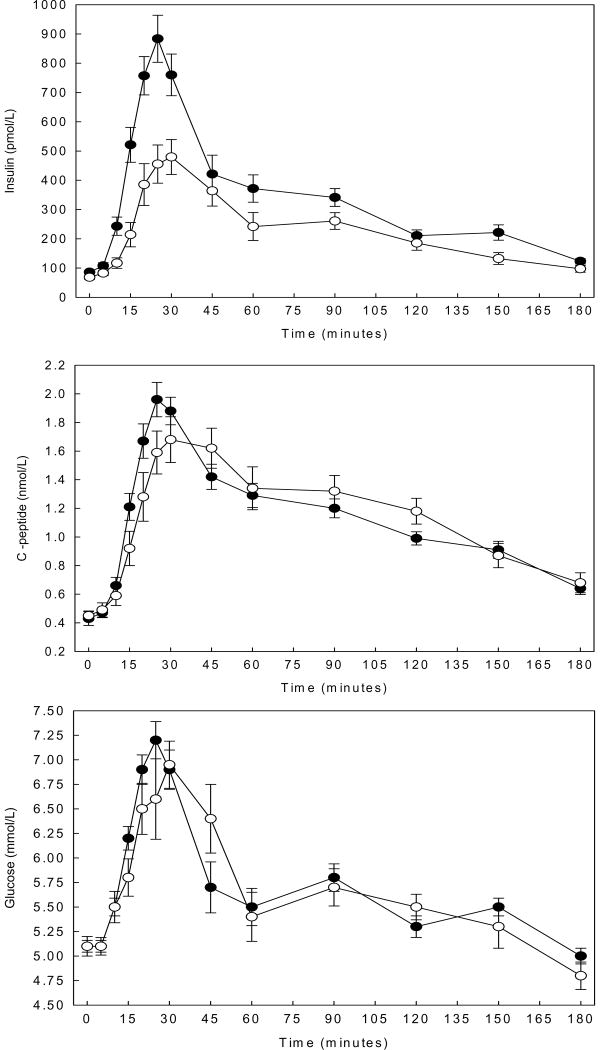
Figure 1.
Insulin, C-peptide, and glucose responses in African American (AA) and European American (EA) children following ingestion of a mixed meal. Data are means ±SE, ●AA n=34 ○EA n=18. “Early response” is defined as the area-under-the curve (AUC) for minutes 0-30 and “late response” as the AUC for minutes 30-180 post challenge. Means were compared by independent samples t-tests.
Panel A. Insulin response. AA had a higher mean early insulin response (P<0.001). AA and EA children did not differ in late insulin response.
Panel B. C-peptide response. Mean early and late C-peptide response did not differ in AA and EA children.
Panel C. Glucose response. Mean early and late glucose response did not differ in AA and EA children.

