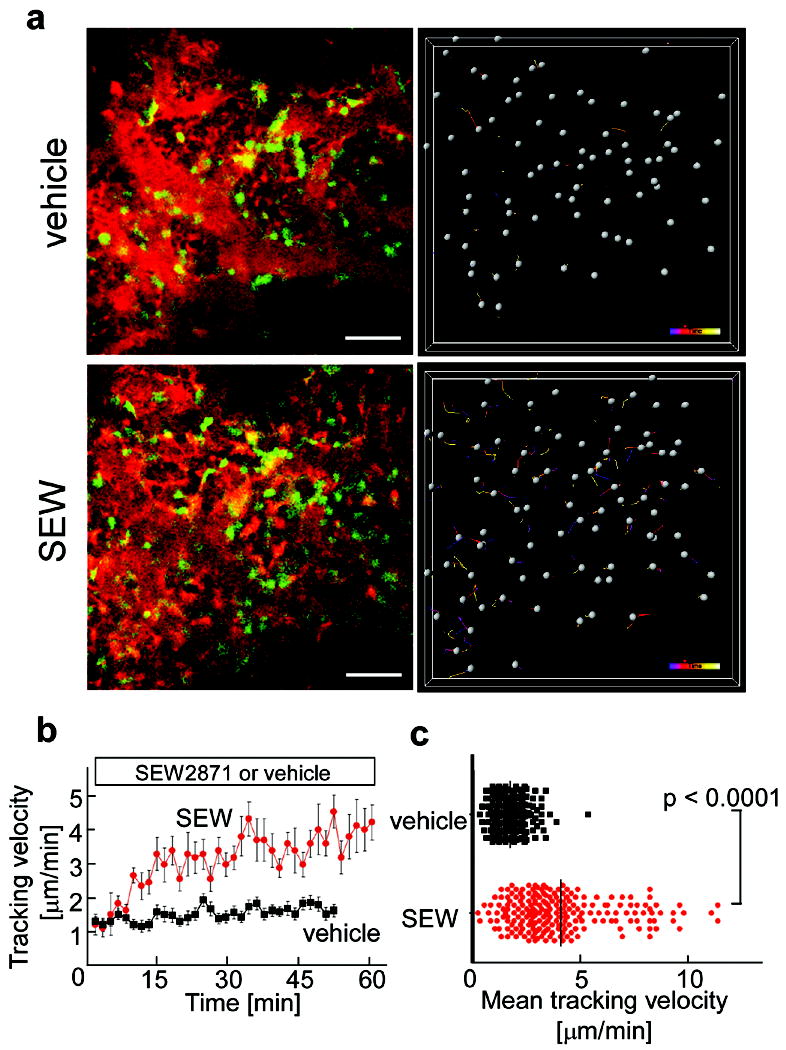
Figure 2. In vivo S1P-mediated increase in motility of osteoclast precursor monocytes visualized using intravital two-photon imaging.

a, Intravital two- photon imaging of mouse skull bone tissues of heterozygous CX3CR1-EGFP knock-in mice, in the absence (upper panels; Supplementary Video 3) or presence (lower panels; Supplementary Video 4) of the S1P1 agonist SEW2871 (5 mg/kg). CX3CR1-EGFP positive cells appear green. The microvasculature was visualized by intravenous injection of 70kDa dextran-conjugated Texas Red (red) (left panels). The movements of CX3CR1-EGFP positive cells were tracked for 10 minutes (right panels). Gray spheres represent cells and colored lines show the associated trajectories. Scale bars represent 50 μm. b, Quantification of CX3CR1-EGFP positive cell velocity. Tracking velocity over time after application of SEW2871 (red circle) or vehicle only (black square) are shown. Data points represent mean values (± SEM) of cell velocities in the field at certain time points (n = 15 for vehicle and n = 14 for SEW 2871). c, Summary of mean velocity of CX3CR1-EGFP positive cells treated with SEW2871 (red circle) or vehicle (black circle). Data points (n = 231 for vehicle and n = 210 for SEW2871) represent individual cells compiled from 5 independent experiments.
