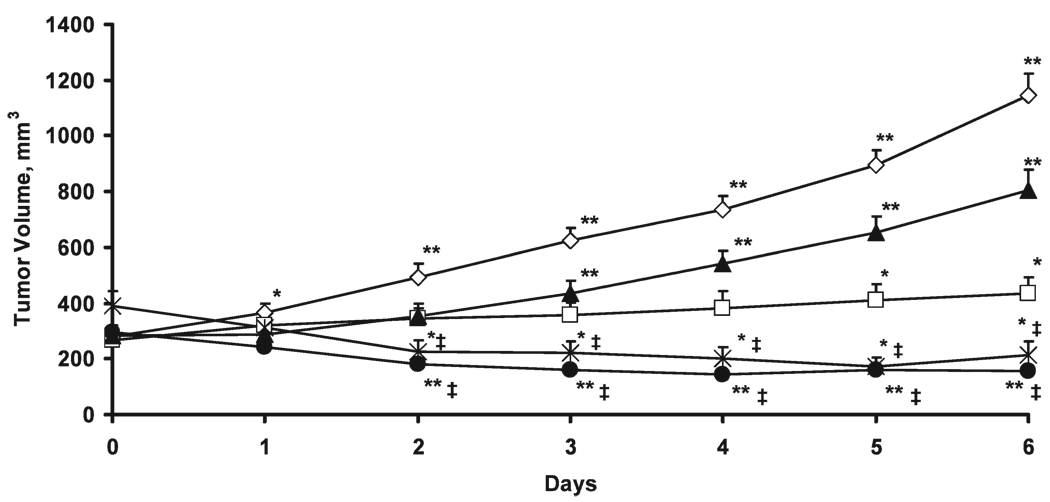
FIG. 2.
Volume of RIF-1 tumors in the control (◊), 20 Gy (□), UCN-01 (▲), and UCN-01/20 Gy (●), and 20 Gy/UCN-01 (✳) groups. The tumor volume is expressed as mean + SE. *P < 0.05 and **P < 0.01 compared with baseline tumor volume (day 0); ‡P < 0.01 compared with control, UCN-01 alone and 20 Gy groups.

