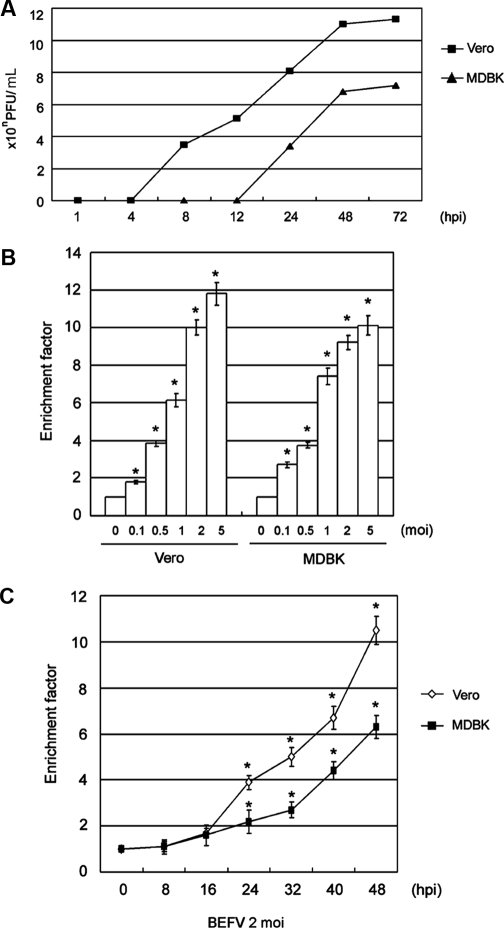
Figure 1.
The different replication and apoptosis induction kinetics in BEFV-infected Vero and MDBK cells. (A) One-step growth curve analysis. Two cell lines were infected with 1 moi BEFV and then incubated for the indicated length of time. Intracellular and extracellular virions were collected by freezing and thawing 3 times, and plaque assay was performed to titrate the virus titer in the infected Vero and MDBK cells. The y-axis represents the virus titer, expressed as plaque-forming units per 0.1 mL. (B) Cell apoptosis levels in Vero and MDBK cells infected with various serial virus doses for 48 h. (C) Apoptosis levels in cells infected with 2 moi BEFV for the indicated length of time. Apoptotic ELISA was performed to quantify the extent of apoptosis. The y-axis represents the enrichment factor. Data are the means ± S.D. of three individual experiments, each performed in duplicate. *p< 0.05 compared with control cells.

