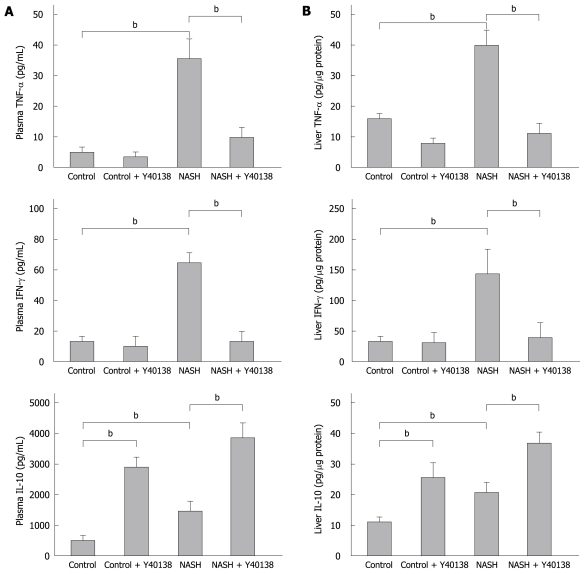
Figure 2.
Tumor necrosis factor-α (TNF-α), interferon-γ (IFN-γ), and interleukin-10 (IL-10) levels in the plasma and liver (ELISA method) in each group (n = 5). A: The plasma TNF-α and IFN-γ levels were significantly elevated in the NASH group, and the increase was attenuated in the NASH + Y-40138 group. The IL-10 levels were increased in the NASH group and further increased in the NASH + Y-40138 group rats. bP < 0.01; B: The liver TNF-α, IFN-γ and IL-10 levels were significantly elevated in the livers of the NASH group rats. TNF-α and IFN-γ levels were attenuated in the NASH + Y-40138 group. The IL-10 levels further increased in NASH + Y-40138 group rats. bP < 0.01.

