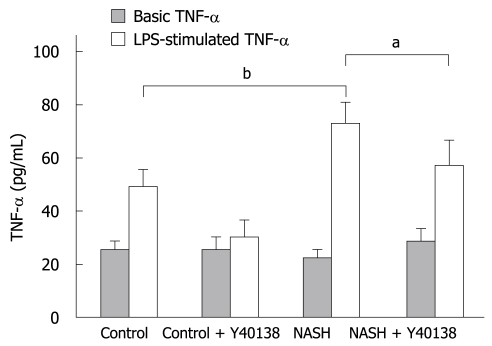
Figure 6.
In-vitro TNF-α production by Kupffer cells. The basal TNF-α production by Kupffer cells isolated from the NASH group (26.6 ± 3.4 pg/mL) was equal to that in the control group (23.4 ± 4.8 pg/mL). After lipopolysaccharide (LPS) stimulation, TNF-α production in the control group (48.9 ± 7.5 pg/mL) was significantly higher than the basal control level, and was significantly higher in the NASH group (73.8 ± 8.4 pg/mL) than in the control group (n = 5). bP < 0.01. TNF-α production in the NASH + Y-40138 group (57.2 ± 10.3 pg/mL) was significantly decreased in comparison to the NASH group (n = 5). aP < 0.05.

