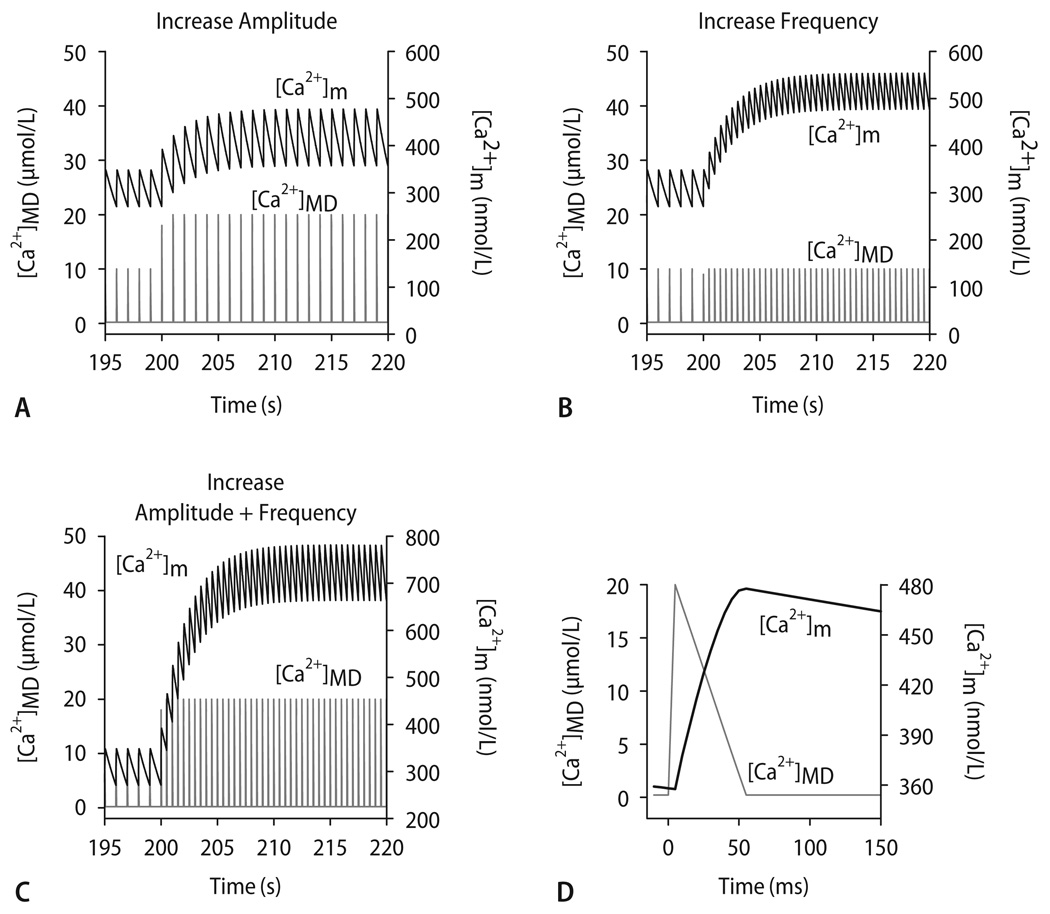
Fig. 8.
Computational modeling of [Ca2+]m, assuming a microdomain (MD) in which mitochondria are exposed to [Ca2+] pulses of 10–20 µmol/L for 50 ms (D; representative pulse taken from t = 215 s in A). Starting from steady-state conditions with [Ca2+]MD oscillating from 0.1 to 10 µmol/L at 1 Hz, an increase of amplitude (A, from 10 to 20 µmol/L), frequency (B, from 1 to 2 Hz) or both (C) of [Ca2+]MD transients were simulated. Reproduced from Maack et al. [117] with permission

