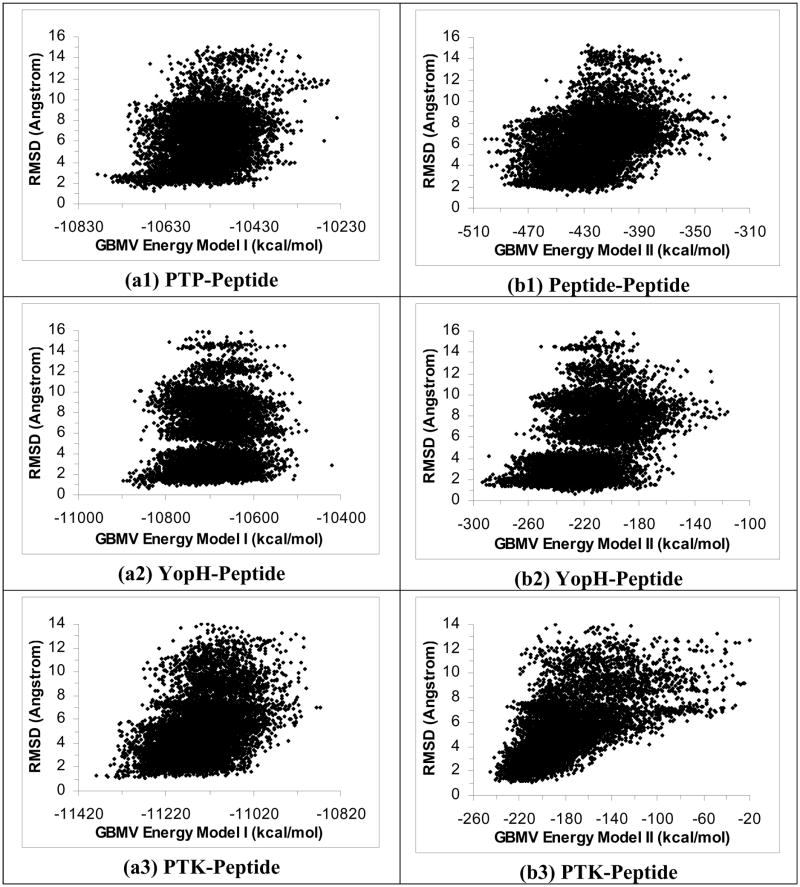
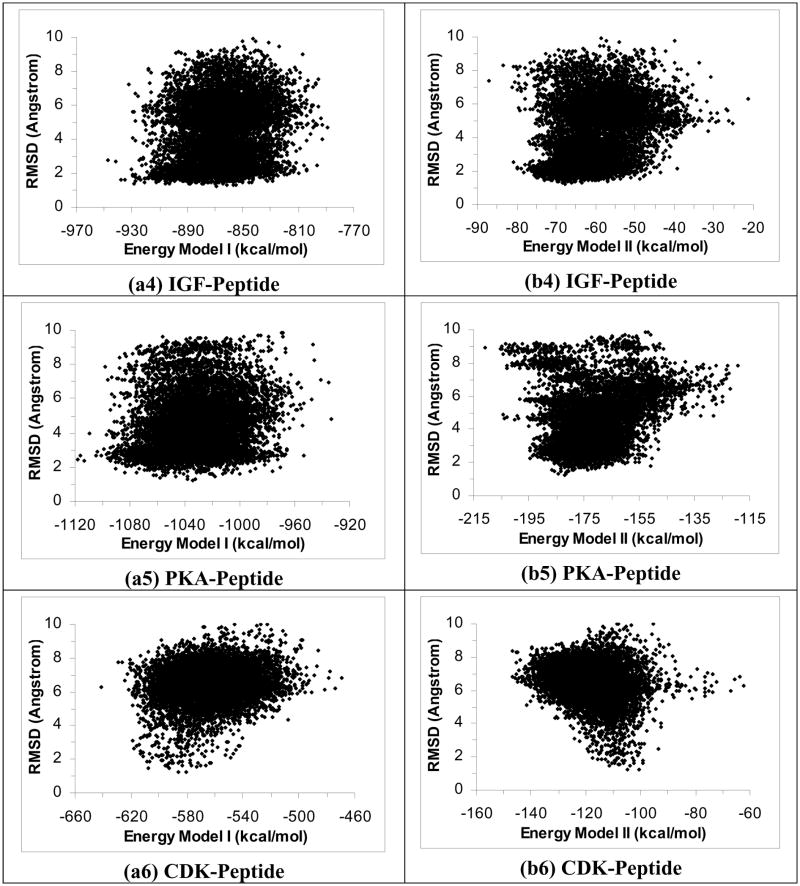
Figure 1.
Plots of RMSD from experiment for the peptide heavy atoms versus energy for 40 2-ns simulated annealing cycling simulations using the ε(r)=4r model. Half of the trajectories were started from the crystal structure and half from the extended conformation on the protein surface. These plots include only structures near local energy minima obtained below 5 K. a1 to a6 are the results for the PTP-peptide, YopH-peptide, PTK-peptide, IGF-peptide, PKA-peptide, and CDK-peptide systems respectively using Energy Model I. b1 to b6 are similar except using Energy Model II to score the structures. (Energy Model I used the total energy of the whole system; Energy Model II excluded the energy of the protein.)


