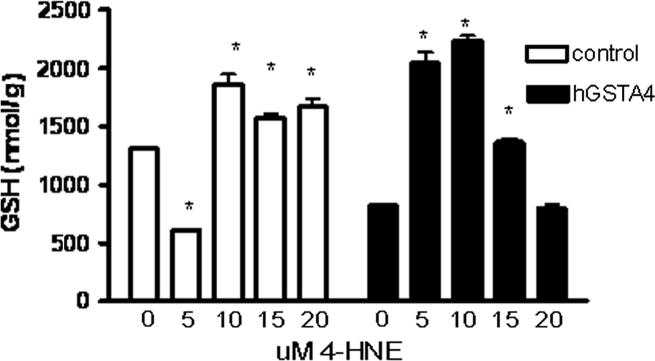
Figure 3.
Effect of 4-HNE on GSH concentrations in control and hGSTA4-transfected cells. HepG2 cells were incubated in the presence of 5–20 μM 4-HNE (or 0.05% ethanol control) and assayed at 2 hr for GSH concentrations. Data represent mean ± standard deviation of three replicate experiments and asterisks indicate significant treatment differences in GSH concentrations from 0 μM control for each cell type at p≤0.05 using one-way ANOVA and the Dunnett’s t-test.

