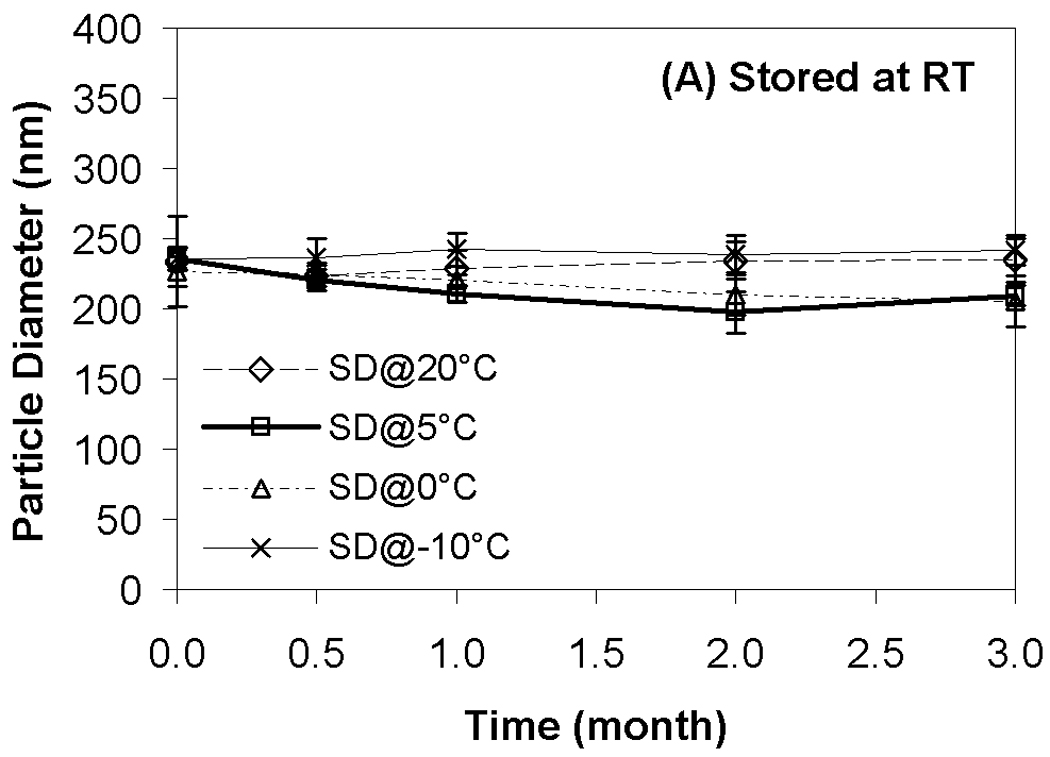
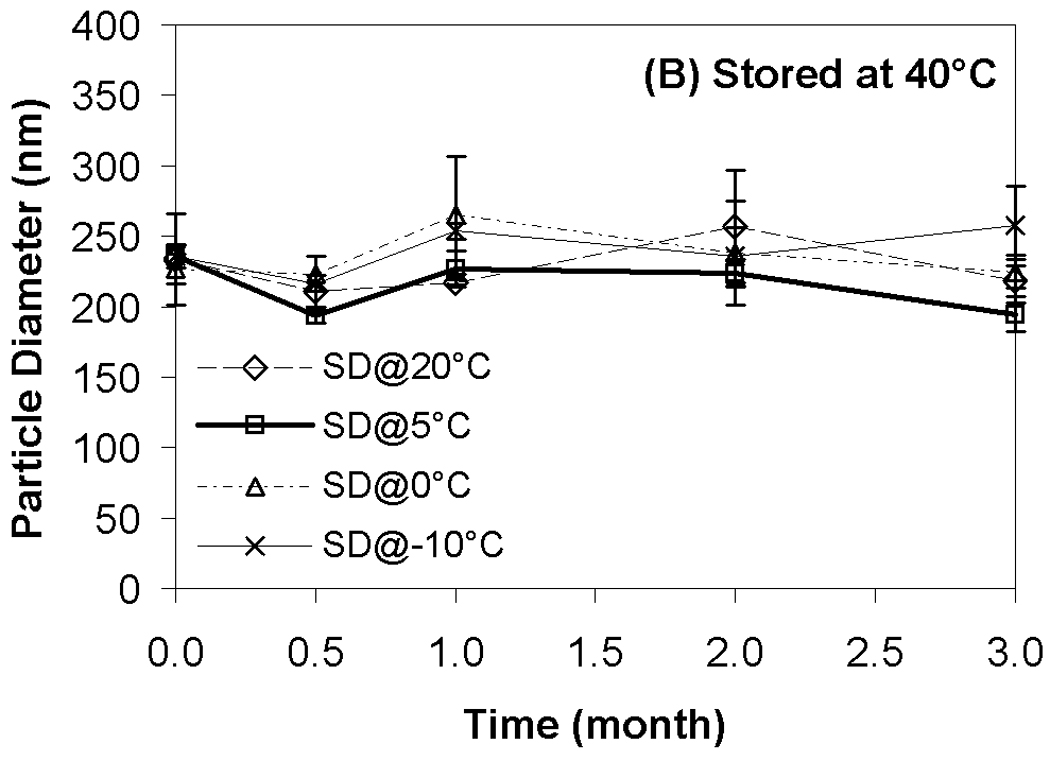
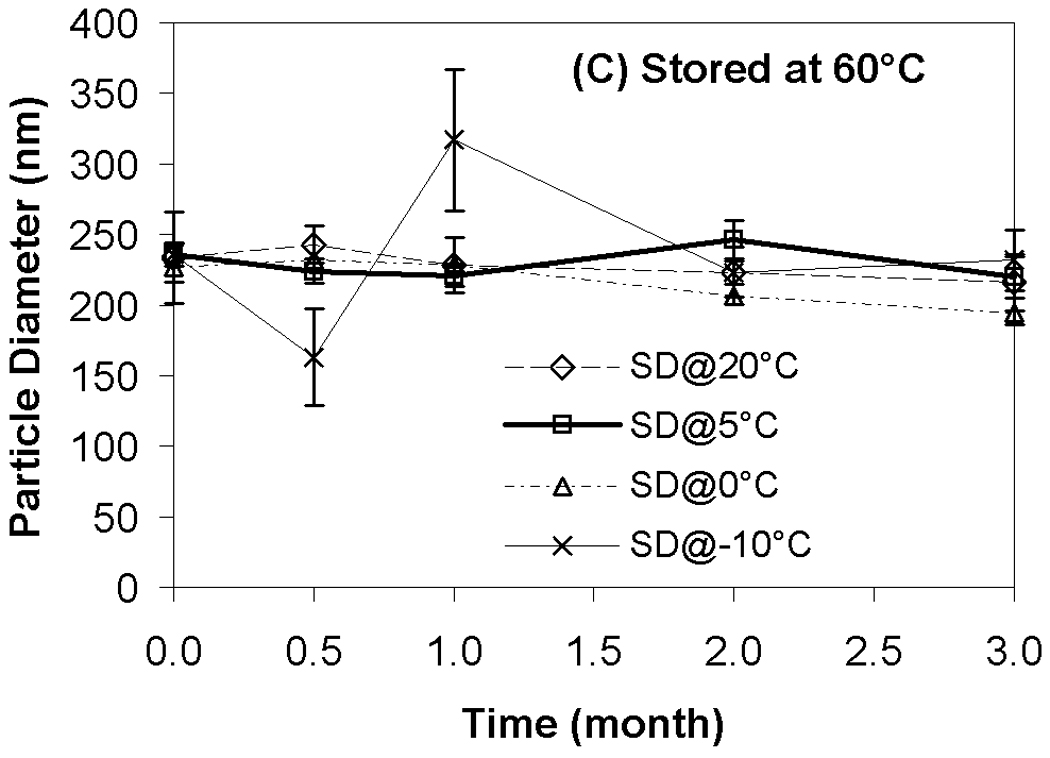
Figure 3.


Effect of moisture content on lipoplex size after freeze-drying and/or storage. Fig. 3A indicates samples stored at room temperature; Fig. 3B, 40°C; Fig. 3C, 60°C. Each bar represents the mean ± one standard error of 4 separate vials. No significant difference between all these data points and fresh controls. SD@ stands for “secondary dried at”.
