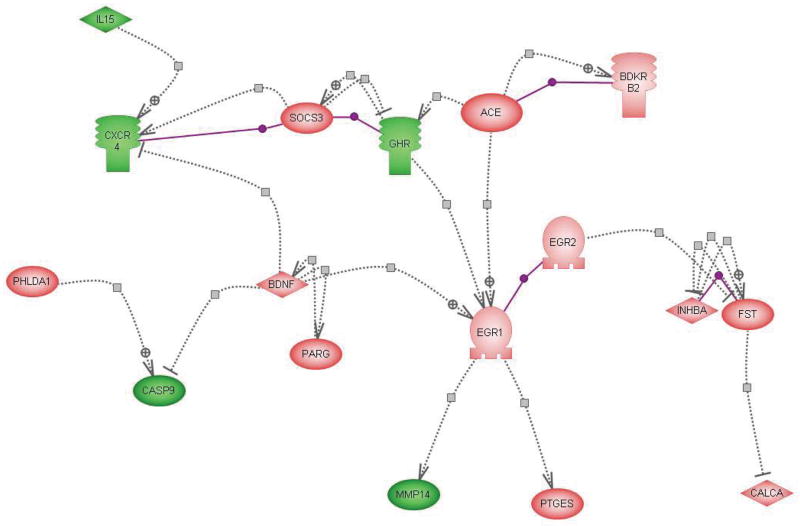
Figure 4.
Direct interaction of changes in gene expression with repeated IMO stress. Pathway analysis showing the direct interactions among genes down- regulated (green, IL15, CXCR4, GHR, CASP9, MMP14)or up-regulated (pink, all others) or by repeated IMO. The symbols are as follows: ligand:  ; transcription factor:
  ; kinase:
  ; receptor:
  nuclear receptor:
  ;: binding::
  positive regulations

