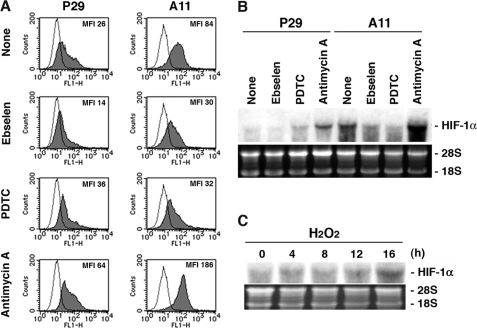
FIGURE 4.
ROS production is correlated with HIF-1α mRNA expression. A, P29 and A11 cells were treated with solvent alone (dimethyl sulfoxide) (None), ebselen (20 μm), PDTC (20 μg/ml), and antimycin A (20 μg/ml) for 18 h. The cells were incubated with 10 μm DCFH-DA for 10 min at 37 °C in serum-free DMEM and then immediately were analyzed with a FACScan flow cytometer. Mean fluorescence intensity (MFI) is also shown. B, P29 and A11 cells were treated as above, and total extracted RNA was subjected to Northern blot analysis. The blots were hybridized with 32P-labeled HIF-1α cDNA. Ethidium bromide staining of the gel is also shown. C, P29 cells were treated with 25 μm H2O2 for up to 16 h. Total extracted RNA was analyzed as in B.

