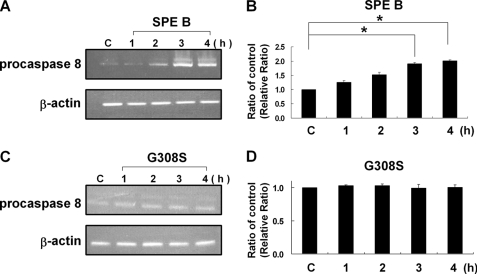
FIGURE 2.
SPE B induced procaspase 8 gene expression. Cells (3 × 10⁶) were treated with SPE B (20 μg/ml) (A) and G308S (20 μg/ml) (C) or PBS (control (C)) for the indicated times. Total RNA was prepared from A549 cells and subjected to RT-PCR analysis of procaspase 8 mRNA expression. The cDNA was amplified with specific oligos for procaspase 8 and β-actin. A quantitative result of procaspase 8 versus β-actin is expressed as the relative ratio in the same way as described in Fig. 1, B and D. Results are the mean ± S.E. of three independent experiments. *, p < 0.05.

