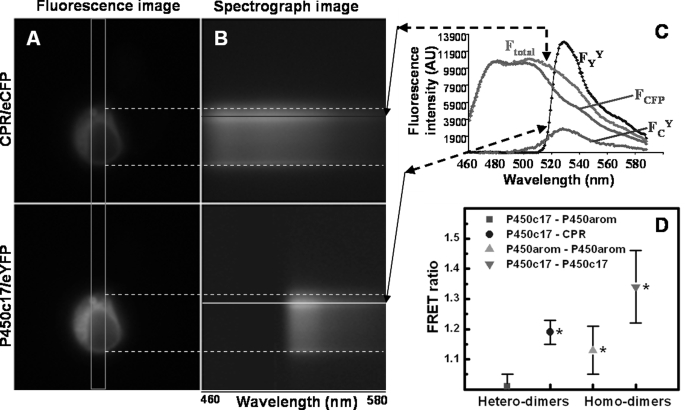
FIGURE 1.
Fluorescence and spectral images, along with experimental and standard emission spectra, of a HEK293 cell co-transfected with and co-expressing CPR-eCFP and P450c17-eYFP fusion constructs. A, pseudo-colored fluorescence images detailing the perinuclear localization of both fusion proteins. B, spectrograph images of both fusion proteins, taken through the slit indicated by the orange rectangle in A. The x axis of the spectrograph images corresponds to wavelength; the y axis corresponds to cell position. Note the presence of the nuclear ghost in the spectrograph images. C, experimental and standard emission spectra necessary for calculation of the FRET ratio of HEK293 cells transfected with P450c17-eYFP and CPR-eCFP fusion constructs. Emission spectra of a given cell region (see colored lines) obtained from excitation at 436 nm (CFP; Ftotal) and 500 nm (YFP; FYY). FCFP is the emission spectrum from cells transfected only with CPR-eCFP, scaled to the spectrum Ftotal. FCY is extracted by subtraction (Ftotal − FCFP) and includes two emission components: one from direct eYFP excitation at 436 nm (FCdirect) and the other from FRET (FCFRET). D, FRET ratios of P450c17, P450arom, and CPR-eCFP/eYFP fusion constructs with hetero- and homodimer interactions in HEK293 cells. FRET was not detected between P450c17-eYFP and P450arom-eCFP (red square; p > 0.5). Interactions were detected for all other combinations of fusion constructs with FRET ratios significantly greater than 1 (*, p < 0.05) and greater than between P450c17-eYFP and P450arom-eCFP.

