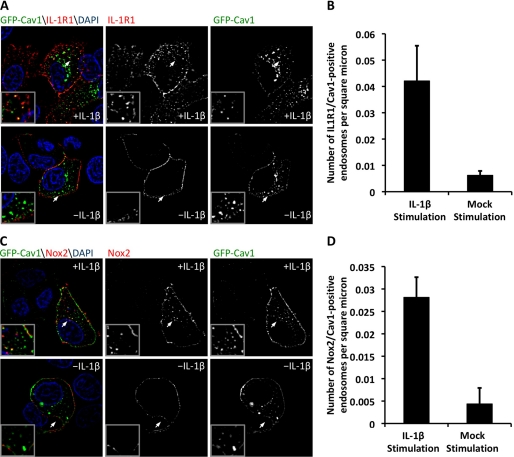
FIGURE 5.
IL-1R1 and Nox2 undergo caveolin-1-mediated endocytosis following IL-1β stimulation. A, to evaluate IL-1R1 localization with caveolin-1 (Cav1)-positive endosomes, MCF-7 cells were transfected with IL-1R1 and GFP-caveolin-1 expression plasmids. At 48 h post-transfection, IL-1R1 was labeled at the plasma membrane by incubation with anti-FLAG antibody at 4 °C. The cells were then pulsed at 37 °C with or without IL-1β stimulation for 20 min and fixed for immunostaining of FLAG. DAPI, 4′,6-diamidino-2-phenylindole. B, the number of IL-1R1- and caveolin-1-positive endosomes per intracellular area was quantified. C, MCF-7 cells were transfected with Nox2 and GFP-caveolin-1 expression plasmids. At 48 h post-transfection, plasma membrane-localized Nox2 was labeled with a monoclonal antibody at 4 °C. The cells were then pulsed at 37 °C with or without IL-1β stimulation for 20 min and fixed for immunostaining of Nox2. The arrows mark the lower left corner of the region in each enlarged inset. D, shown is the MetaMorph quantification of the fraction of Nox2- and caveolin-1-positive endosomes. For all image analysis studies, a minimum of 24 cells were imaged per condition from a total of three independent experiments. Values represent the mean ± S.D. (n = 3). B and D demonstrate a statistical difference between mock- and IL-1β-stimulated conditions as assessed by Student's t test (p < 0.01 (B) and p < 0.005 (D)).

