FIGURE 7.
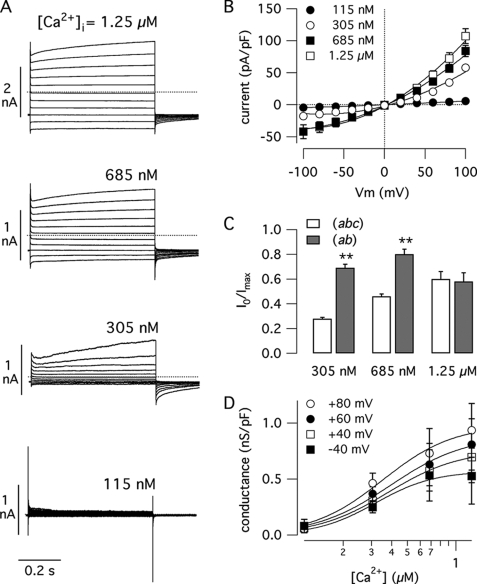
Properties of TMEM16(ab). A, representative whole cell membrane currents recorded in FRT cells with stable expression of TMEM16A(ab) at the indicated intracellular Ca2+ concentrations. B, current-voltage relationships from similar experiments (mean ± S.E., n = 8–13). pF, picofarads. C, normalized instantaneous current at 100 mV (determined as in Fig. 3D) for TMEM16(ab) compared with the (abc) isoform. Asterisks indicate a significant difference (p < 0.01). D, Ca2+ sensitivity of the (ab) isoform. Plot of membrane conductance versus Ca2+ concentration at the indicated membrane potentials is shown (mean ± S.E., n = 8–13).

