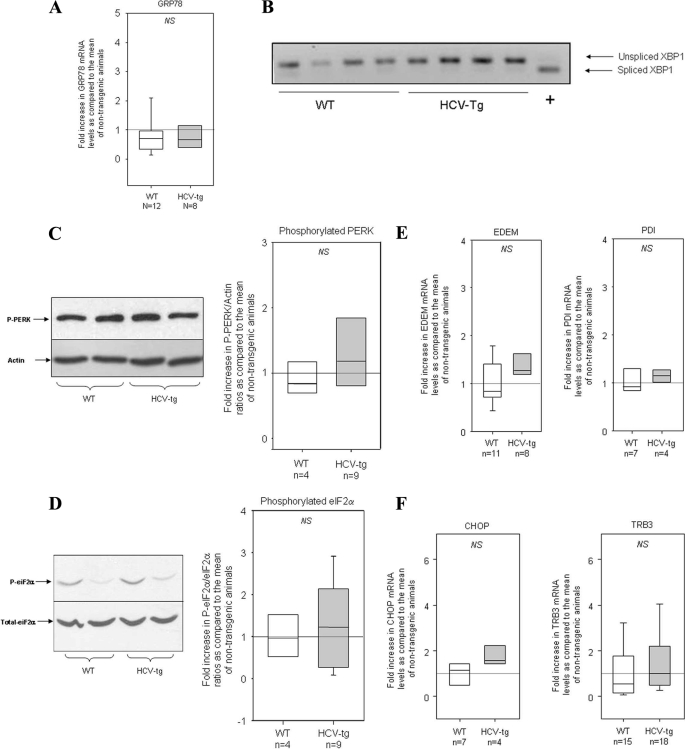
FIGURE 4.
A, GRP78 mRNA levels assessed by RT-qPCR in the liver of WT mice and HCV transgenic littermates (HCV-tg). The results were normalized to the mean expression level in WT liver. Box-and-whisker graphs are used. Values in WT and HCV-tg mice were compared with the Mann and Whitney test. B, unspliced and spliced XBP1 mRNA transcripts in liver RNA extracts from WT and HCV-tg mice, as assessed by RNA size discrimination on agarose gel. A positive control (+) showing spliced XBP1 was migrated in parallel. C, respective amounts of the phosphorylated form of PERK, as assessed by Western blot, in WT and HCV-tg mice. Left panel, representative Western blot; right panel, box-and-whisker graphs. The values in WT and HCV-tg mice were compared with the Mann and Whitney test. D, respective amounts of the phosphorylated form of eIF2α, as assessed by Western blot, in WT and HCV-tg mice. Left panel, representative Western blot; right panel, box-and-whisker graphs. The values in WT and HCV-tg mice were compared with the Mann and Whitney test. E, EDEM and protein-disulfide isomerase mRNA levels assessed by RT-qPCR in the liver of WT and HCV-tg mice. The results were normalized to the mean expression level in WT liver. Box-and-whisker graphs are used. The values in WT and HCV-tg mice were compared with the Mann and Whitney test. F, CHOP and TRB3 mRNA levels assessed by RT-qPCR in the liver of WT and HCV-tg mice. The results were normalized to the mean expression level in WT liver. Box-and-whisker graphs are used. The values in WT and HCV-tg mice were compared with the Mann and Whitney test.

