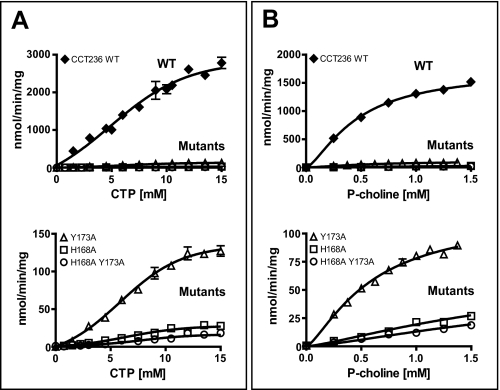
FIGURE 6.
Kinetic analysis of the CCT236 wild-type and active site mutant constructs. A, plots of initial velocity versus [CTP]. The P-choline concentration was held at 1.5 mm. B, plots of initial velocity versus [P-choline]. The CTP concentration was held at 8.8 mm. Data are means ± S.E. of four independent determinations (error bars are within symbol for many points). The data were fit to an equation for an allosteric sigmoidal curve (Y = Vmax Xn/K* + Xn; n = Hill coefficient) using GraphPad Prism 4. R2 values for the fits ranged from 0.88 to 0.98. The top panels show results for all constructs; the bottom panels show results for the three mutants only. Note the different y axis scales.

