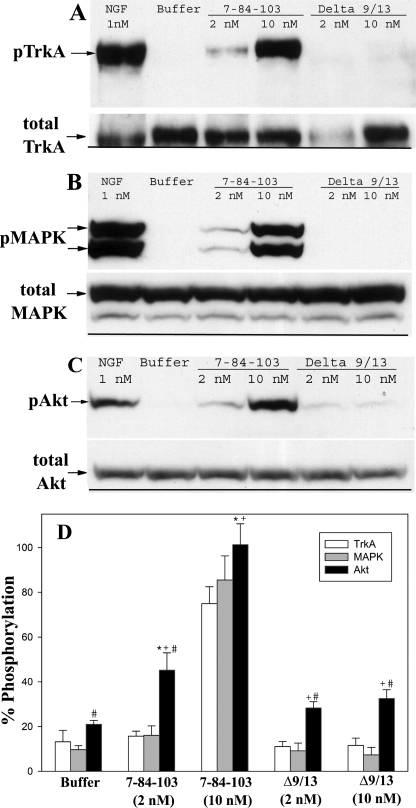
FIGURE 10.
Phosphorylation of TrkA, MAPK, and Akt (protein kinase B) in PC12 cells. Cells were treated with the indicated concentration of mβNGF, mutein, or control and assayed for phosphorylated proteins as described under “Materials and Methods.” A, Western blot of pTrkA and total TrkA (lower panel); arrows show position of phospho-TrkA band. B, Western blot of pMAPK and total MAPK (lower panel); arrows show position of phospho-MAPK doublet band. C, Western blot of pAKT and total AKT (lower panel); arrow shows position of phospho-Akt band. D, quantification of TrkA, MAPK, and Akt phosphorylation. Data are presented as mean ± S.D. of three separate experiments. *, unadjusted p < 0.001 significantly different for Akt phosphorylation with respect to buffer; #, unadjusted p < 0.001 significantly different for Akt phosphorylation with respect to MAPK phosphorylation for the same treatment; +, unadjusted p < 0.001 significantly different for Akt phosphorylation with respect to TrkA phosphorylation for the same treatment. Statistical significance calculated by one-way analysis of variance using the Holm-Sidak method in SigmaPlot.

