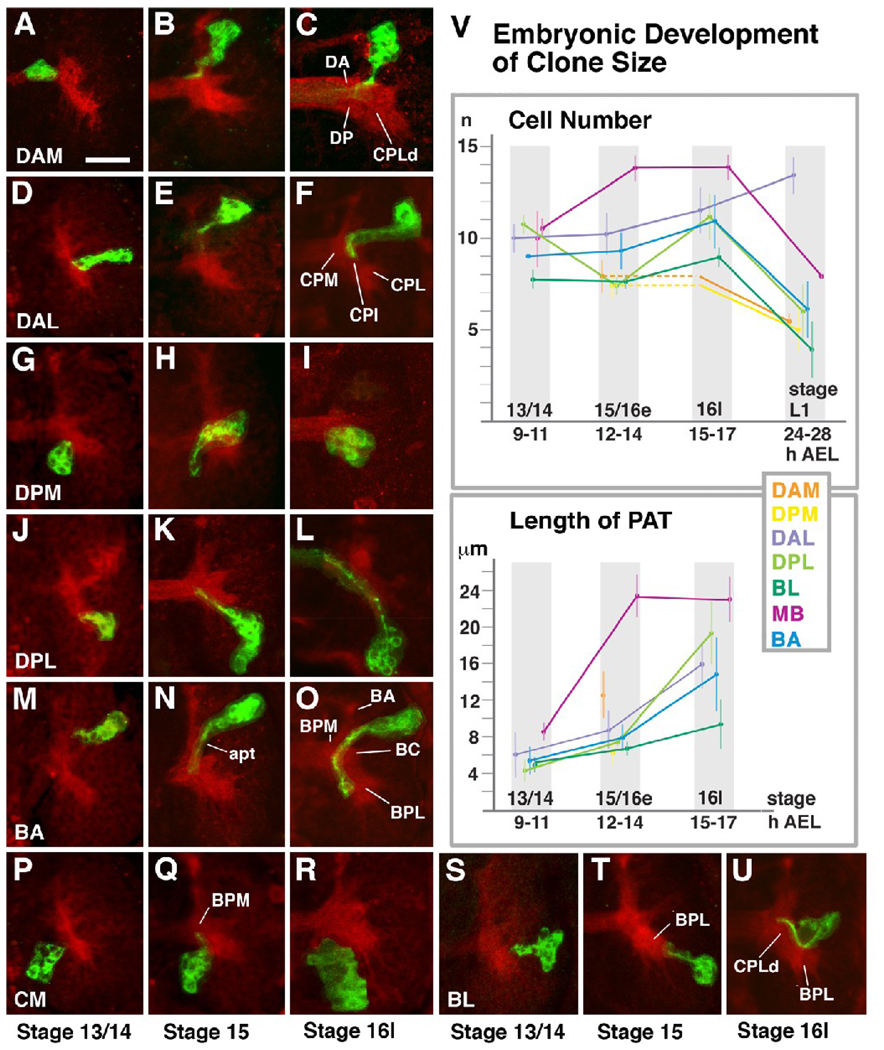
Fig.2.
Morphogenesis of brain lineages during the embryonic period. Panels A–U show Z-Projections of horizontal confocal sections of right brain hemisphere (anterior to the top, lateral to the right). Neuropile was labeled with anti-DNcad (red). Individual lineages (“primary clones”) were labeled by inducing mCD8-GFP (green) in embryonic neuroblasts at around 5h post fertilization. Each row (A–C, D–F, etc) shows clone representing a given group of lineages, indicated at the lower left corner (e.g., DAM, DAL, etc; see Fig.1). Left panel of a given row shows clone at stage 13/14 (9–11h); middle panel depicts clones fixed at stage 15/early 16 (12–14h); clones illustrated in right panel were fixed at 15–17h (stage late16/ early 17). Graphs in panel V quantify average number of cells per clone of a given group (upper graph) and average length of axon tract (PAT) at different stages of development. For the measurements, 150 clones were analyzed quantitatively (BA: 20; BL: 32; CM: 4; DAL: 26; DAM: 10; DPL: 34; DPM: 9; MB: 15). For a given stage, the number of data points ranged between three and 12. Somata could be individually counted because the GFP expression leaves the cell nucleus free of label, or labeled weakly. Error bars in the curves reflect one standard deviation. For some families of lineages we did not have sufficient representation at certain stages. For example, in case of DAM and DPM we could score clones only at stage 15/16e and L1. We used the T-test to compare clone sizes and PAT length. To label the difference between averages as significant, a P-value < 0.05 was assumed. Colors represent different groups of lineages; color key is given at top of lower graph. At all stages, lineages of the MB, DAL and DPL group are significantly larger than lineages of BL, DAM and DPM (p=0.05); differences in cell numbers among MB/DAL/DPL/BA, or DAM/DPM/BL/BA, are not significant. The change in clone size over time is significant for all lineage groups between late embryo (stage 16l) and larva. Other than that, only the increase in size of MB lineages between stage 13/14 and 15/16e is significant, as well as the dip in size of DPL lineages. MB neuroblasts divide even in the late embryo, which explains the first change; we have no explanation for the dip in the DPL curve. In regard to PAT length (lower graph), differences among lineage groups at stage 13/14 are not significant. The increase in PAT length between stage 15/16e and 16l is significant (p=0.05) for all groups. For more details see text.
For abbreviation of lineages and neuropile compartments see legend of Fig.1. Other abbreviations: apt antenno-protocerebral tract, AEL after egg laying
Bar: 20µm

