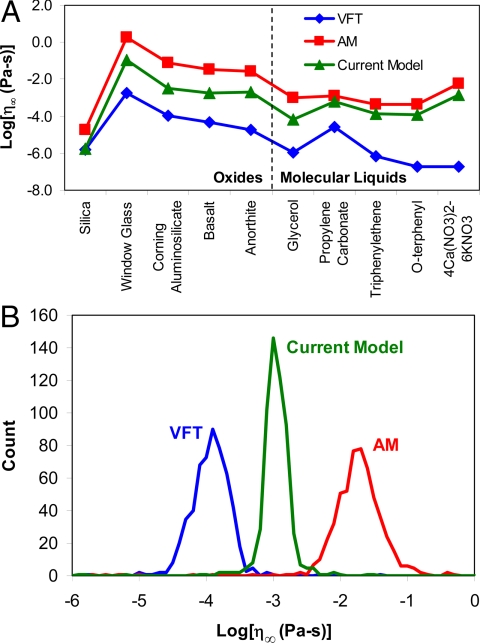
Fig. 3.
Extrapolated infinite temperature viscosity. (A) Distribution of η∞(x) values for the compositions in Fig. 2. (B) Histogram of η∞(x) values for the best-fit viscosity curves of 568 different Corning aluminosilicate compositions. The current model produces the narrowest distribution of η∞(x) values.

