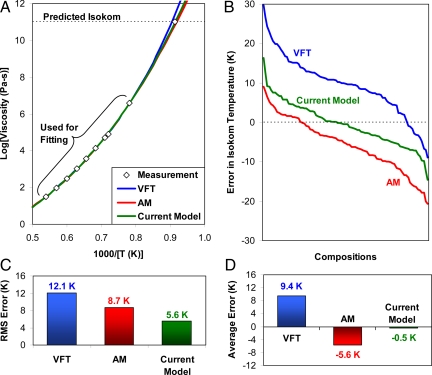
Fig. 4.
Results of the low-temperature extrapolation test. (A) Low-temperature extrapolation test, where the viscosity models are fit to high-temperature viscosity data and then extrapolated to predict the 1011 Pa-s isokom temperature. (B) Error in the predicted 1011 Pa-s isokom for 85 Corning compositions. The compositions on the horizontal axis are ordered in terms of descending error for the three models. A given position on the horizontal axis generally corresponds to three different liquids. (C) Root mean square error in the predicted isokom temperature using the three different models. (D) Average error in the predicted isokom temperature.

