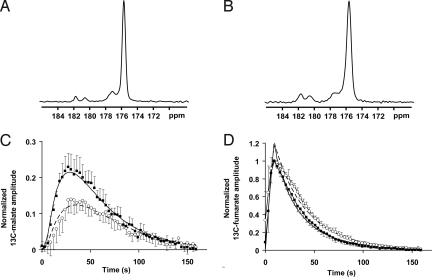
Fig. 3.
13C spectra acquired from slices through subcutaneous murine lymphoma tumors. (A and B) Untreated (A) and etopside-treated (B) tumors 30 s after the i.v. injection of hyperpolarized [1,4-13C2]fumarate; these are representative spectra from the experiments shown in C and D. The signal from hyperpolarized fumarate is seen at 175.4 ppm, the signal from [1-13C]malate is seen at ≈181.8 ppm, and the signal from [4-13C]malate is seen at ≈180.6 ppm. An unidentified contaminant is seen at ≈177 ppm. (C) Total hyperpolarized 13C malate signal over time (i.e., the summed intensities of [1-13C] and [4-13C]malate) normalized to the maximum [1,4-13C2]fumarate signal for untreated (○) and etoposide-treated (■) animals (± SD, n = 5). (D) Hyperpolarized [1,4-13C2]fumarate signal in the same animals as in C. The superimposed curves represent the average fits for both the fumarate and the malate resonances using the kinetic modeling described in the text (assuming TM = TF). The solid line represents treated animals, and the dashed line represents untreated animals.

