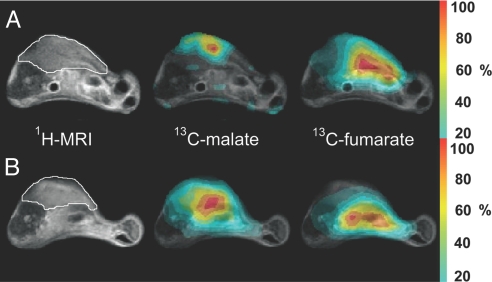
Fig. 4.
Representative transverse images from untreated (A) and etoposide-treated (B) mice with s.c.-implanted lymphoma tumors. The 1H image shows the anatomical location of the tumor, outlined in white. Adjacent to this are false-color CSIs superimposed on the 1H image, which demonstrate the spatial distribution of the total hyperpolarized 13C malate and 13C fumarate signals. The color scale indicates the relative signal intensity compared with the maximum intensity in each image. To reduce the effects of noise, voxels with signal intensities ≤20% of the maximum signal intensity were removed from the image. Although the images have been scaled to their respective maxima, the maximum malate signal intensity in each experiment is ≈10–25% of the maximum fumarate signal.

