Fig. 3.
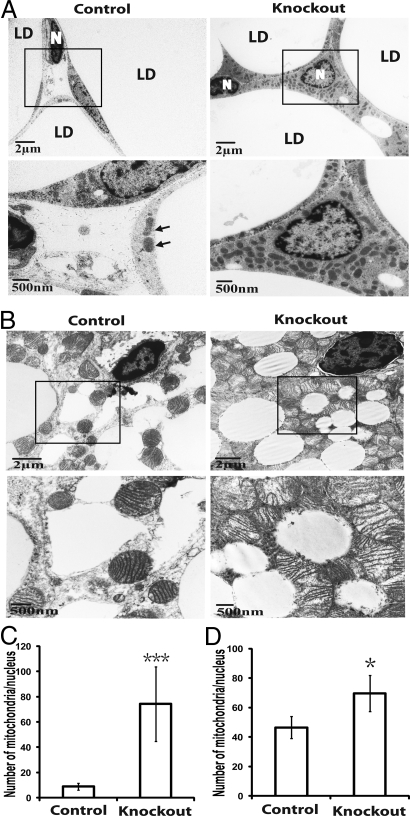
Adipose-specific atg7 knockout mice accumulated more mitochondria in WAT and BAT (brown adipose tissue). (A) Electron microscopic pictures of adipocytes from uterine WAT of control and adipose-specific atg7 knockout mice. Selected regions in low magnification images (within the squares) are shown below in high magnification. LD, lipid droplet; N, nucleus; arrows indicate mitochondria in the control tissue sample. (B) Representative electron microscopic pictures of interscapular BAT from control and atg7 conditional knockout mice. Selected regions in low magnification images (within the squares) are shown below in high magnification. (C and D) Quantification of mitochondria in WAT and BAT of control and adipose-specific atg7 knockout mice, respectively. Mitochondria number was counted in 25 random cells and expressed as the number of mitochondria per nucleus. *, P < 0.05; ***, P < 0.001, Student's t test.

