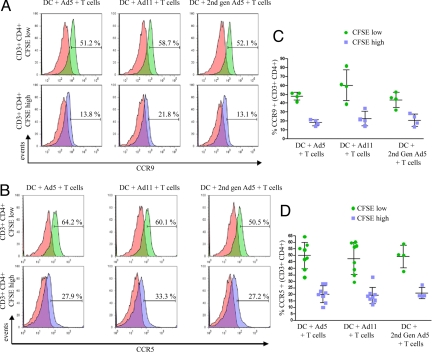
Fig. 3.
CCR5 and CCR9 expression by expanded Ad-specific CD4 T cells. CFSE-labeled T cells were co-cultured with Ad5, Ad11, or second-generation Ad5-pulsed DCs. CCR9 (A) and CCR5 (B) expression by divided CFSElow (green histograms) or undivided CFSEhigh CD3+ CD4+ T lymphocytes (blue histograms) was measured by flow cytometry. Red histograms represent the non-specific staining using the appropriate isotype controls. Plots are representative of four samples for CCR9 and eight samples for CCR5. (C and D) The cumulative data for CCR9 and CCR5, respectively, are shown with lines representing means ± SD.

