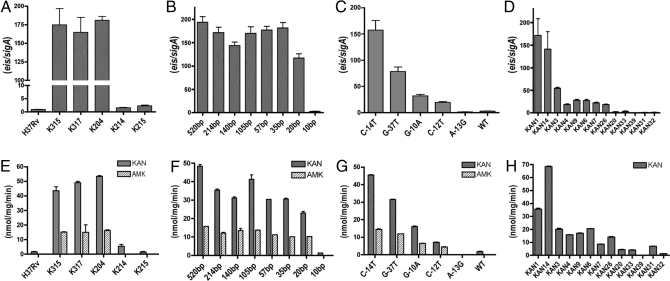
Fig. 2.
Analysis of eis expression and acetyltransferase activity. The ratio of eis/sigA transcripts (A–D) was determined by qRT-PCR and normalized to H37Rv. (A) H37Rv, K204, and allelic exchange derivatives. (B) H37RvΔeis complemented with eis promoter truncation constructs; bp (base pairs) indicates the length of sequence upstream from the eis start codon present on the complementing plasmid. (C) H37RvΔeis complemented with eis promoter alleles. (D) Clinical isolates. Acetyltransferase activity (E–H) was measured from crude cell lysates and is expressed in nmol per mg per min. (E) H37Rv, K204, and allelic exchange derivatives. (F) H37RvΔeis complemented with eis promoter truncation constructs. (G) H37RvΔeis complemented with different eis promoter alleles (H) Clinical isolates. In all panels, error bars represent 3 independent experiments.

