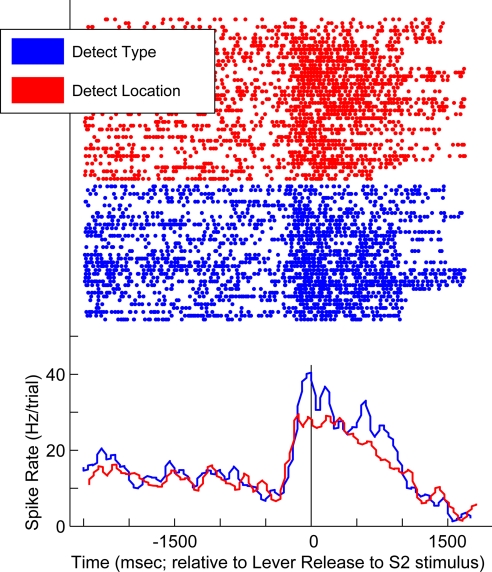
Fig. 1.
Response profile of a vPFC neuron recorded during the detect tasks. Data generated during the detect-type task are shown in blue; data generated during the detect-location task are shown in red. The rasters and peri-stimulus time histograms are aligned relative to the lever release initiated by the release-S2 stimulus; the vertical black line indicates this time point. The histograms were generated by binning spike times into 40-ms bins.

