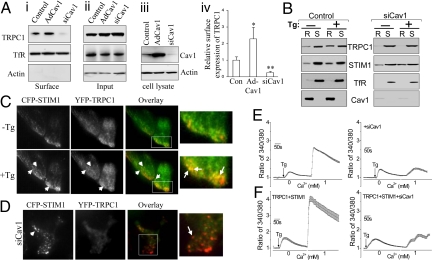
Fig. 1.
Cav1 is required for plasma membrane expression of TRPC1 and clustering with STIM1. (A i–iii) Biotinylation of TRPC1 in control, Cav1-expressing (Ad-Cav1) and Cav1-silenced (siCav1) HSG cells. (Aiv) Relative surface expression of TRPC1, normalized to expression of transferin receptor (TfR). * and ** represent significant differences relative to control (Con), P < 0.05, and 0.01, respectively. (B) Tg-mediated recruitment of TRPC1 and STIM1 into lipid raft domains in control or siCav1 cells (R, insoluble fraction representing LRD; S, soluble fractions representing non-rafts). (C) TIRFM imaging of CFP-STIM1 (red) and YFP-TRPC1 (green) in resting (-Tg) and stimulated (+Tg) cells. Co-localization, yellow, is seen in overlay images (arrows indicate TRPC1-STIM1 clusters, enlarged areas shown; also see Movie S1). (D) Localization of CFP-STIM1 and YFP-TRPC1 in siCav1-treated cells after Tg stimulation (arrows indicate STIM1 puncta, red, which are not seen before stimulation). (E and F). Fura 2 fluorescence measurements in control and TRPC1+STIM1 expressing HSG cells (siCav1 treatment is indicated in traces on right). Each trace represents the average obtained from at least 50 cells.

