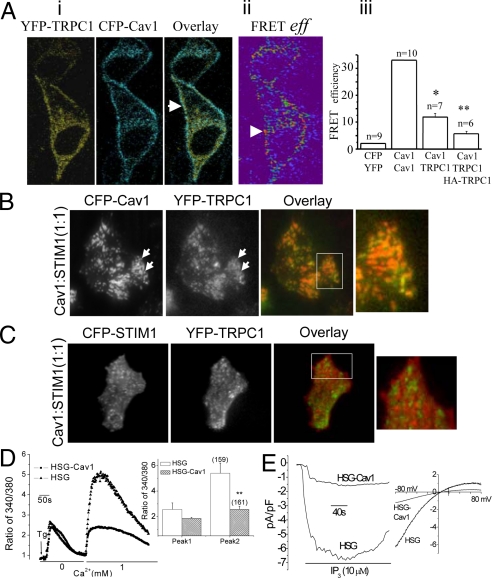
Fig. 2.
Functional consequence of TRPC1-Cav1 association. (A) FRET measurements in HSG cells expressing YFP-TRPC1 and CFP-Cav1. (i) Localization of the proteins (shown by arrows). (ii) Detection of FRET. (iii) Quantitation of data (FRETeff ± SEM); a significant difference (*, P < 0.05) was noted between Cav1-TRPC1 vs. YFP-CFP or Cav1-TRPC1-HATRPC1; and (**, P < 0.05) between Cav1-TRPC1 vs. Cav1-TRPC1-HATRPC1. (B) Localization of CFP-Cav1 (red) and YFP-TRPC1 (green) in Tg-stimulated HSG cells expressing HA-STIM1 (1:1 cDNA ratio of STIM1 relative to CFP-Cav1). Images before stimulation are not shown since there was no change with stimulation. (C) Localization of CFP-STIM1 and YFP-TRPC1 in Tg-stimulated cells expressing HA-Cav1 (1:1 cDNA ratio of STIM1 and Cav1). (D) Tg-stimulated calcium changes in HSG cells transfected with Cav1, bar graph shows quantitation. (E) ISOC measurements in Cav1-expressing HSG cells with IP3 in the pipette solution (similar data were obtained with Tg).

