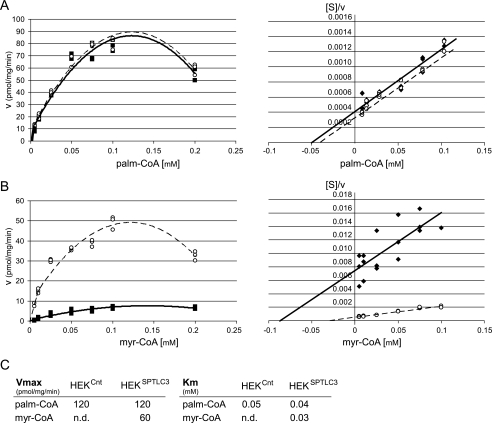
FIGURE 3.
Kinetic analysis of SPTLC3 activity in HEKCnt and HEKSPTLC3 for palmitoyl (palm)-CoA and myristoyl (myr)-CoA. A, for palmitoyl-CoA, both cell lines showed an identical kinetic behavior. The kinetics followed a Michaelis-Menten curve up to a substrate concentration of 0.1 mm (left panel). Above that concentration activity was reduced because of substrate inhibition. The Hanes-Woolf representation (right panel) revealed an inverse linear correlation between substrate concentration and reaction velocity. B, HEKSPTLC3 cells showed significantly increased activity with myristoyl-CoA in comparison to control cells (HEKCnt). Also, with myristoyl-CoA we observed a Michaelis-Menten kinetic up to 0.1 mm and substrate inhibition at higher concentrations. Maximal activity was seen at myristoyl-CoA concentrations between 0.1 and 0.125 mm. The Hanes-Woolf plot for myristoyl-CoA also showed an inverse linear correlation between substrate concentration and reaction velocity. C, Vmax and Km values were deduced from the Hanes blot and confirmed by a hyperbolic regression analysis. With palmitoyl-CoA the Vmax and Km values were identical for both cell lines, whereas Vmax for myristoyl-CoA was significantly lower in control cells (HEKCnt) compared with the SPTLC3-expressing cells (HEKSPTLC3). In HEKSPTLC3 cells, the Km for myristoyl-CoA and palmitoyl-CoA were comparable, whereas Vmax for myristoyl-CoA was about 50% lower than for palmitoyl (palm)-CoA. For HEKCnt cells the Km and Vmax of myristoyl (myr)-CoA could not be reliably determined (n.d.) because of low enzymatic activity with myristoyl-CoA in these cells.

