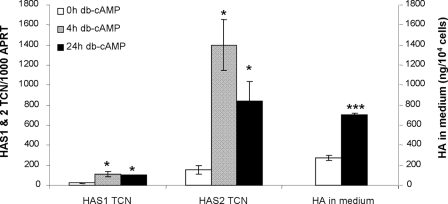
FIGURE 2.
HAS1 and HAS2 transcript levels (expressed per 1000 copies of the APRT housekeeper gene) and HA secreted into the medium (reported as ng/104 cells) are both the means ± S. E. in preadipocytes (n = 8) untreated (0 h) or following 4 or 24 h of treatment with 10−3m db-cAMP. *, p < 0.05; ***, p < 0.0005 (Student's).

