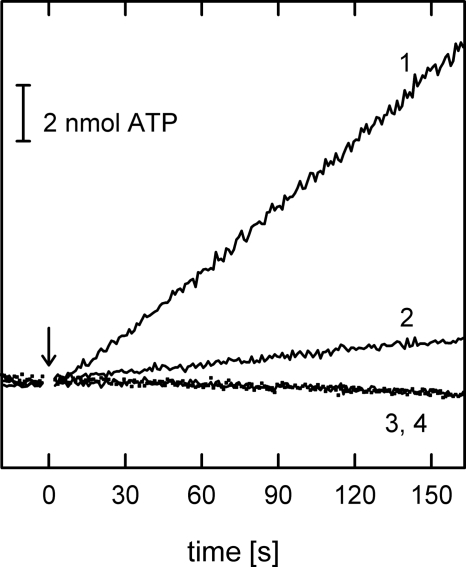
FIGURE 3.
Time course of ATP synthesis. The light output at 562 nm from the luciferin/luciferase reaction is shown as a function of time. The reaction was started at t = 0 s (indicated by the arrow) by the addition of succinate.1, wild-type TF1Fo; 2, TF1Fo(γQ36stop); 3 (solid line), TF1Fo(γQ36stop/ϵI88stop); 4 (dotted line), pUC118/DK8 (no F1Fo). The bar in the upper left shows the light output of a 2-nmol ATP standard. Details of the reaction conditions are described under “Materials and Methods.”

