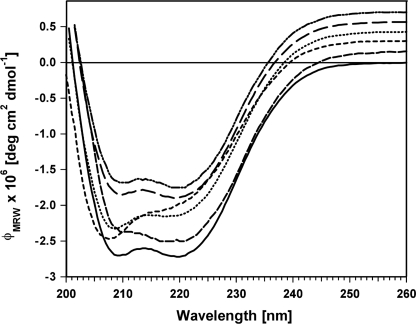
FIGURE 3.
CD spectra of SalR and mutants. For clarity, the spectra have been shifted to more positive values. All curves normally end at 0.0 deg cm2 dmol−1 at 260 nm, as shown for the wild type. From bottom to top, at 260 nm the CD spectra are for wild-type SalR (solid line), L185A (medium dash line), L185S (small dash line), K186V (dotted line), M271A (large dash line), and N272A (double dot dash line).

