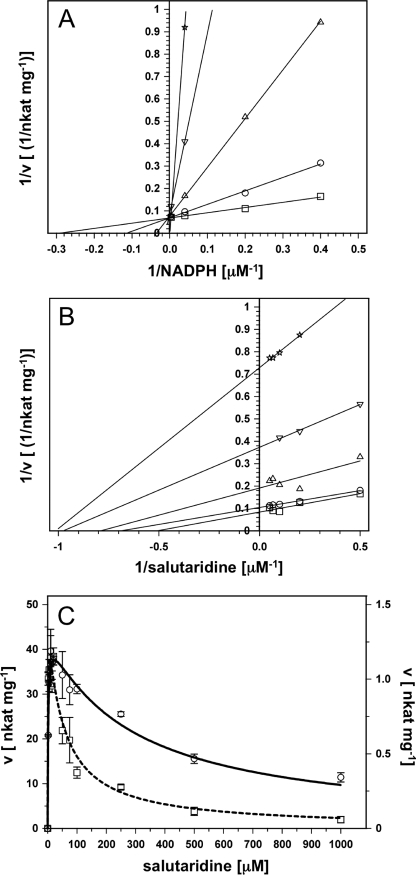
FIGURE 4.
NADP+ inhibition studies of wild-type SalR. A, double reciprocal plot of NADP+ inhibition at variable NADPH concentrations and at a constant salutaridine concentration of 20 μm. NADP+ concentrations (μm): 0 (squares), 2.5 (circles), 25 (triangles up), 100 (triangles down), and 250 μm (stars). B, double reciprocal plot of NADP+ inhibition at variable salutaridine concentrations at a constant NADPH concentration of 25 μm. NADP+ concentrations (μm): 0 (squares), 2.5 (circles), 25 (triangles up), 50 (triangles down), and 100 μm (stars). C, velocity/substrate concentration curve for SalR in the absence (solid line) or presence (dashed line) of 25 μm NADP+. The data were recorded in the presence of 250 μm NADPH. Note the difference in scale for the curve in the absence (left y axis) and presence (right y axis) of the inhibitor.

